
 Yahoo Finance
 Cleveland-Cliffs (NYSE:CLF) shareholders have earned a 18% CAGR over the last five years
When you buy shares in a company, it's worth keeping in mind the possibility that it could fail, and you could lose your money. But on a lighter note, a good company can see its share price rise well over 100%. For instance, the price of Cleveland-Cliffs Inc. (NYSE:CLF) stock is up an impressive 117% over the last five years. The last week saw the share price soften some 1.2%.
So let's assess the underlying fundamentals over the last 5 years and see if they've moved in lock-step with shareholder returns.
See our latest analysis for Cleveland-Cliffs
To paraphrase Benjamin Graham: Over the short term the market is a voting machine, but over the long term it's a weighing machine. By comparing earnings per share (EPS) and share price changes over time, we can get a feel for how investor attitudes to a company have morphed over time.
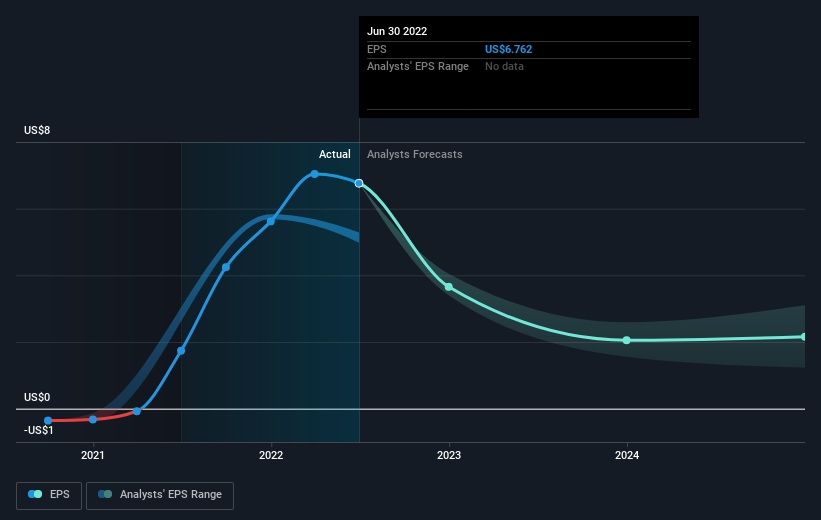
During five years of share price growth, Cleveland-Cliffs achieved compound earnings per share (EPS) growth of 82% per year. The EPS growth is more impressive than the yearly share price gain of 17% over the same period. Therefore, it seems the market has become relatively pessimistic about the company. This cautious sentiment is reflected in its (fairly low) P/E ratio of 2.27.
You can see how EPS has changed over time in the image below (click on the chart to see the exact values).
It's probably worth noting we've seen significant insider buying in the last quarter, which we consider a positive. That said, we think earnings and revenue growth trends are even more important factors to consider. Before buying or selling a stock, we always recommend a close examination of historic growth trends, available here..
What About The Total Shareholder Return (TSR)?
We'd be remiss not to mention the difference between Cleveland-Cliffs' total shareholder return (TSR) and its share price return. The TSR is a return calculation that accounts for the value of cash dividends (assuming that any dividend received was reinvested) and the calculated value of any discounted capital raisings and spin-offs. Dividends have been really beneficial for Cleveland-Cliffs shareholders, and that cash payout contributed to why its TSR of 129%, over the last 5 years, is better than the share price return.
A Different Perspective
While the broader market lost about 23% in the twelve months, Cleveland-Cliffs shareholders did even worse, losing 28%. Having said that, it's inevitable that some stocks will be oversold in a falling market. The key is to keep your eyes on the fundamental developments. Longer term investors wouldn't be so upset, since they would have made 18%, each year, over five years. If the fundamental data continues to indicate long term sustainable growth, the current sell-off could be an opportunity worth considering. While it is well worth considering the different impacts that market conditions can have on the share price, there are other factors that are even more important. To that end, you should learn about the 3 warning signs we've spotted with Cleveland-Cliffs (including 1 which is concerning) .
If you like to buy stocks alongside management, then you might just love this free list of companies. (Hint: insiders have been buying them).
Please note, the market returns quoted in this article reflect the market weighted average returns of stocks that currently trade on US exchanges.
Have feedback on this article? Concerned about the content? Get in touch with us directly. Alternatively, email editorial-team (at) simplywallst.com.
This article by Simply Wall St is general in nature. We provide commentary based on historical data and analyst forecasts only using an unbiased methodology and our articles are not intended to be financial advice. It does not constitute a recommendation to buy or sell any stock, and does not take account of your objectives, or your financial situation. We aim to bring you long-term focused analysis driven by fundamental data. Note that our analysis may not factor in the latest price-sensitive company announcements or qualitative material. Simply Wall St has no position in any stocks mentioned.
Join A Paid User Research Session
You’ll receive a US$30 Amazon Gift card for 1 hour of your time while helping us build better investing tools for the individual investors like yourself. Sign up here
