
 Yahoo Finance
 CISO Global Inc. (NASDAQ:CISO) Screens Well But There Might Be A Catch
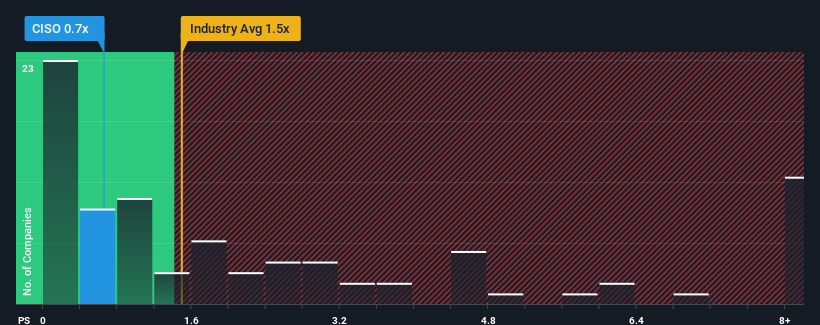
CISO Global Inc.'s (NASDAQ:CISO) price-to-sales (or "P/S") ratio of 0.7x might make it look like a buy right now compared to the IT industry in the United States, where around half of the companies have P/S ratios above 1.5x and even P/S above 4x are quite common. However, the P/S might be low for a reason and it requires further investigation to determine if it's justified.
See our latest analysis for CISO Global
What Does CISO Global's P/S Mean For Shareholders?
CISO Global certainly has been doing a good job lately as it's been growing revenue more than most other companies. One possibility is that the P/S ratio is low because investors think this strong revenue performance might be less impressive moving forward. If the company manages to stay the course, then investors should be rewarded with a share price that matches its revenue figures.
Want the full picture on analyst estimates for the company? Then our free report on CISO Global will help you uncover what's on the horizon.
How Is CISO Global's Revenue Growth Trending?
The only time you'd be truly comfortable seeing a P/S as low as CISO Global's is when the company's growth is on track to lag the industry.
If we review the last year of revenue growth, the company posted a terrific increase of 133%. The latest three year period has also seen an incredible overall rise in revenue, aided by its incredible short-term performance. Therefore, it's fair to say the revenue growth recently has been superb for the company.
Shifting to the future, estimates from the only analyst covering the company suggest revenue should grow by 57% over the next year. Meanwhile, the rest of the industry is forecast to only expand by 11%, which is noticeably less attractive.
With this information, we find it odd that CISO Global is trading at a P/S lower than the industry. Apparently some shareholders are doubtful of the forecasts and have been accepting significantly lower selling prices.
What We Can Learn From CISO Global's P/S?
Using the price-to-sales ratio alone to determine if you should sell your stock isn't sensible, however it can be a practical guide to the company's future prospects.
A look at CISO Global's revenues reveals that, despite glowing future growth forecasts, its P/S is much lower than we'd expect. There could be some major risk factors that are placing downward pressure on the P/S ratio. It appears the market could be anticipating revenue instability, because these conditions should normally provide a boost to the share price.
Before you settle on your opinion, we've discovered 5 warning signs for CISO Global (1 is a bit unpleasant!) that you should be aware of.
It's important to make sure you look for a great company, not just the first idea you come across. So if growing profitability aligns with your idea of a great company, take a peek at this free list of interesting companies with strong recent earnings growth (and a low P/E).
Have feedback on this article? Concerned about the content? Get in touch with us directly. Alternatively, email editorial-team (at) simplywallst.com.
This article by Simply Wall St is general in nature. We provide commentary based on historical data and analyst forecasts only using an unbiased methodology and our articles are not intended to be financial advice. It does not constitute a recommendation to buy or sell any stock, and does not take account of your objectives, or your financial situation. We aim to bring you long-term focused analysis driven by fundamental data. Note that our analysis may not factor in the latest price-sensitive company announcements or qualitative material. Simply Wall St has no position in any stocks mentioned.
Join A Paid User Research Session
You’ll receive a US$30 Amazon Gift card for 1 hour of your time while helping us build better investing tools for the individual investors like yourself. Sign up here
