
 Yahoo Finance
 Chubb (NYSE:CB) sheds 4.1% this week, as yearly returns fall more in line with earnings growth
The main point of investing for the long term is to make money. But more than that, you probably want to see it rise more than the market average. But Chubb Limited (NYSE:CB) has fallen short of that second goal, with a share price rise of 71% over five years, which is below the market return. However, more recent buyers should be happy with the increase of 33% over the last year.
Although Chubb has shed US$4.6b from its market cap this week, let's take a look at its longer term fundamental trends and see if they've driven returns.
Check out our latest analysis for Chubb
To paraphrase Benjamin Graham: Over the short term the market is a voting machine, but over the long term it's a weighing machine. By comparing earnings per share (EPS) and share price changes over time, we can get a feel for how investor attitudes to a company have morphed over time.
During five years of share price growth, Chubb achieved compound earnings per share (EPS) growth of 21% per year. This EPS growth is higher than the 11% average annual increase in the share price. So it seems the market isn't so enthusiastic about the stock these days. This cautious sentiment is reflected in its (fairly low) P/E ratio of 11.54.
You can see below how EPS has changed over time (discover the exact values by clicking on the image).
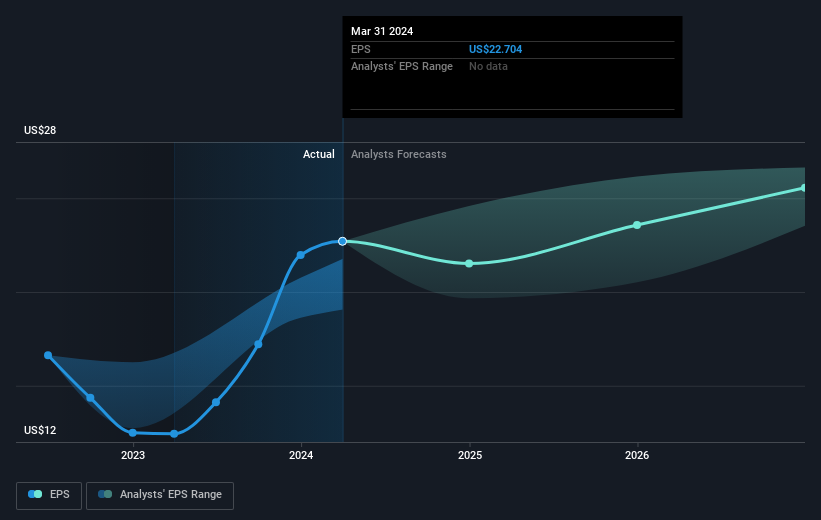
We know that Chubb has improved its bottom line lately, but is it going to grow revenue? Check if analysts think Chubb will grow revenue in the future.
What About Dividends?
It is important to consider the total shareholder return, as well as the share price return, for any given stock. The TSR incorporates the value of any spin-offs or discounted capital raisings, along with any dividends, based on the assumption that the dividends are reinvested. Arguably, the TSR gives a more comprehensive picture of the return generated by a stock. In the case of Chubb, it has a TSR of 87% for the last 5 years. That exceeds its share price return that we previously mentioned. This is largely a result of its dividend payments!
A Different Perspective
We're pleased to report that Chubb shareholders have received a total shareholder return of 35% over one year. Of course, that includes the dividend. That gain is better than the annual TSR over five years, which is 13%. Therefore it seems like sentiment around the company has been positive lately. Someone with an optimistic perspective could view the recent improvement in TSR as indicating that the business itself is getting better with time. It's always interesting to track share price performance over the longer term. But to understand Chubb better, we need to consider many other factors. Consider for instance, the ever-present spectre of investment risk. We've identified 2 warning signs with Chubb , and understanding them should be part of your investment process.
If you would prefer to check out another company -- one with potentially superior financials -- then do not miss this free list of companies that have proven they can grow earnings.
Please note, the market returns quoted in this article reflect the market weighted average returns of stocks that currently trade on American exchanges.
Have feedback on this article? Concerned about the content? Get in touch with us directly. Alternatively, email editorial-team (at) simplywallst.com.
This article by Simply Wall St is general in nature. We provide commentary based on historical data and analyst forecasts only using an unbiased methodology and our articles are not intended to be financial advice. It does not constitute a recommendation to buy or sell any stock, and does not take account of your objectives, or your financial situation. We aim to bring you long-term focused analysis driven by fundamental data. Note that our analysis may not factor in the latest price-sensitive company announcements or qualitative material. Simply Wall St has no position in any stocks mentioned.
Have feedback on this article? Concerned about the content? Get in touch with us directly. Alternatively, email editorial-team@simplywallst.com
