
 Yahoo Finance
 China Gold International Resources' (TSE:CGG) Returns On Capital Are Heading Higher
Did you know there are some financial metrics that can provide clues of a potential multi-bagger? Ideally, a business will show two trends; firstly a growing return on capital employed (ROCE) and secondly, an increasing amount of capital employed. This shows us that it's a compounding machine, able to continually reinvest its earnings back into the business and generate higher returns. With that in mind, we've noticed some promising trends at China Gold International Resources (TSE:CGG) so let's look a bit deeper.
Understanding Return On Capital Employed (ROCE)
Just to clarify if you're unsure, ROCE is a metric for evaluating how much pre-tax income (in percentage terms) a company earns on the capital invested in its business. Analysts use this formula to calculate it for China Gold International Resources:
Return on Capital Employed = Earnings Before Interest and Tax (EBIT) ÷ (Total Assets - Current Liabilities)
0.10 = US$298m ÷ (US$3.3b - US$407m) (Based on the trailing twelve months to June 2021).
Therefore, China Gold International Resources has an ROCE of 10%. In absolute terms, that's a satisfactory return, but compared to the Metals and Mining industry average of 2.5% it's much better.
See our latest analysis for China Gold International Resources
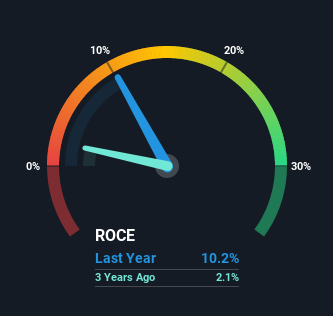
Above you can see how the current ROCE for China Gold International Resources compares to its prior returns on capital, but there's only so much you can tell from the past. If you'd like, you can check out the forecasts from the analysts covering China Gold International Resources here for free.
What The Trend Of ROCE Can Tell Us
China Gold International Resources' ROCE growth is quite impressive. The figures show that over the last five years, ROCE has grown 1,539% whilst employing roughly the same amount of capital. Basically the business is generating higher returns from the same amount of capital and that is proof that there are improvements in the company's efficiencies. On that front, things are looking good so it's worth exploring what management has said about growth plans going forward.
The Key Takeaway
To sum it up, China Gold International Resources is collecting higher returns from the same amount of capital, and that's impressive. Since the stock has returned a solid 47% to shareholders over the last five years, it's fair to say investors are beginning to recognize these changes. In light of that, we think it's worth looking further into this stock because if China Gold International Resources can keep these trends up, it could have a bright future ahead.
One more thing to note, we've identified 1 warning sign with China Gold International Resources and understanding it should be part of your investment process.
For those who like to invest in solid companies, check out this free list of companies with solid balance sheets and high returns on equity.
This article by Simply Wall St is general in nature. We provide commentary based on historical data and analyst forecasts only using an unbiased methodology and our articles are not intended to be financial advice. It does not constitute a recommendation to buy or sell any stock, and does not take account of your objectives, or your financial situation. We aim to bring you long-term focused analysis driven by fundamental data. Note that our analysis may not factor in the latest price-sensitive company announcements or qualitative material. Simply Wall St has no position in any stocks mentioned.
Have feedback on this article? Concerned about the content? Get in touch with us directly. Alternatively, email editorial-team (at) simplywallst.com.
