
 Yahoo Finance
 China Gold International Resources (TSE:CGG) shareholders have earned a 43% CAGR over the last three years
China Gold International Resources Corp. Ltd. (TSE:CGG) shareholders might be concerned after seeing the share price drop 11% in the last month. But that doesn't undermine the rather lovely longer-term return, if you measure over the last three years. In three years the stock price has launched 167% higher: a great result. To some, the recent share price pullback wouldn't be surprising after such a good run. Only time will tell if there is still too much optimism currently reflected in the share price.
With that in mind, it's worth seeing if the company's underlying fundamentals have been the driver of long term performance, or if there are some discrepancies.
See our latest analysis for China Gold International Resources
There is no denying that markets are sometimes efficient, but prices do not always reflect underlying business performance. One flawed but reasonable way to assess how sentiment around a company has changed is to compare the earnings per share (EPS) with the share price.
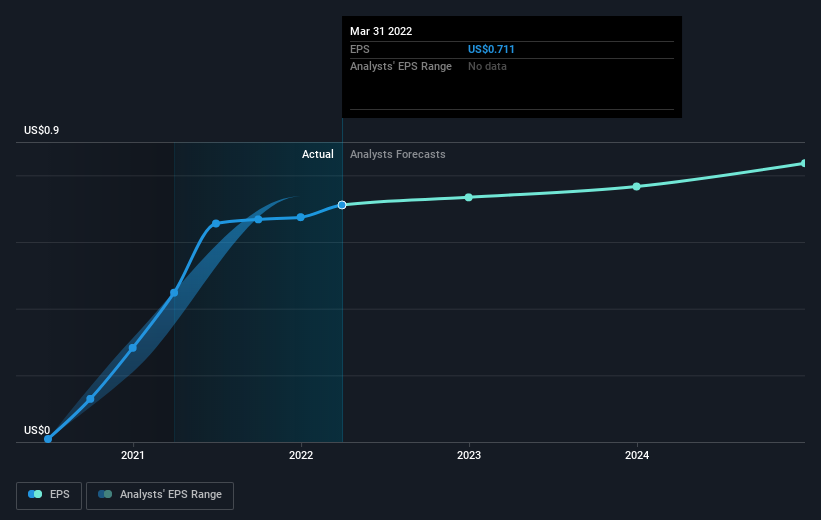
China Gold International Resources became profitable within the last three years. That kind of transition can be an inflection point that justifies a strong share price gain, just as we have seen here.
The company's earnings per share (over time) is depicted in the image below (click to see the exact numbers).
It is of course excellent to see how China Gold International Resources has grown profits over the years, but the future is more important for shareholders. This free interactive report on China Gold International Resources' balance sheet strength is a great place to start, if you want to investigate the stock further.
What About Dividends?
It is important to consider the total shareholder return, as well as the share price return, for any given stock. Whereas the share price return only reflects the change in the share price, the TSR includes the value of dividends (assuming they were reinvested) and the benefit of any discounted capital raising or spin-off. Arguably, the TSR gives a more comprehensive picture of the return generated by a stock. In the case of China Gold International Resources, it has a TSR of 195% for the last 3 years. That exceeds its share price return that we previously mentioned. This is largely a result of its dividend payments!
A Different Perspective
China Gold International Resources shareholders have received returns of 7.0% over twelve months (even including dividends), which isn't far from the general market return. We should note here that the five-year TSR is more impressive, at 18% per year. Although the share price growth has slowed, the longer term story points to a business well worth watching. I find it very interesting to look at share price over the long term as a proxy for business performance. But to truly gain insight, we need to consider other information, too. To that end, you should be aware of the 2 warning signs we've spotted with China Gold International Resources .
Of course China Gold International Resources may not be the best stock to buy. So you may wish to see this free collection of growth stocks.
Please note, the market returns quoted in this article reflect the market weighted average returns of stocks that currently trade on CA exchanges.
Have feedback on this article? Concerned about the content? Get in touch with us directly. Alternatively, email editorial-team (at) simplywallst.com.
This article by Simply Wall St is general in nature. We provide commentary based on historical data and analyst forecasts only using an unbiased methodology and our articles are not intended to be financial advice. It does not constitute a recommendation to buy or sell any stock, and does not take account of your objectives, or your financial situation. We aim to bring you long-term focused analysis driven by fundamental data. Note that our analysis may not factor in the latest price-sensitive company announcements or qualitative material. Simply Wall St has no position in any stocks mentioned.