
 Yahoo Finance
 We Like Cheniere Energy's (NYSE:LNG) Returns And Here's How They're Trending
If you're looking for a multi-bagger, there's a few things to keep an eye out for. Firstly, we'll want to see a proven return on capital employed (ROCE) that is increasing, and secondly, an expanding base of capital employed. Ultimately, this demonstrates that it's a business that is reinvesting profits at increasing rates of return. So when we looked at the ROCE trend of Cheniere Energy (NYSE:LNG) we really liked what we saw.
What Is Return On Capital Employed (ROCE)?
Just to clarify if you're unsure, ROCE is a metric for evaluating how much pre-tax income (in percentage terms) a company earns on the capital invested in its business. The formula for this calculation on Cheniere Energy is:
Return on Capital Employed = Earnings Before Interest and Tax (EBIT) ÷ (Total Assets - Current Liabilities)
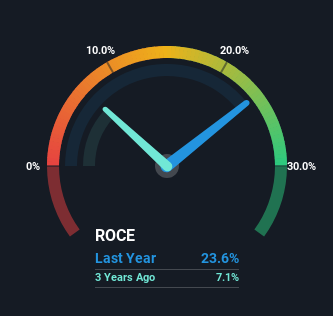
0.24 = US$8.7b ÷ (US$43b - US$6.2b) (Based on the trailing twelve months to March 2024).
So, Cheniere Energy has an ROCE of 24%. That's a fantastic return and not only that, it outpaces the average of 13% earned by companies in a similar industry.
See our latest analysis for Cheniere Energy
Above you can see how the current ROCE for Cheniere Energy compares to its prior returns on capital, but there's only so much you can tell from the past. If you'd like to see what analysts are forecasting going forward, you should check out our free analyst report for Cheniere Energy .
What Does the ROCE Trend For Cheniere Energy Tell Us?
Cheniere Energy's ROCE growth is quite impressive. The figures show that over the last five years, ROCE has grown 296% whilst employing roughly the same amount of capital. Basically the business is generating higher returns from the same amount of capital and that is proof that there are improvements in the company's efficiencies. On that front, things are looking good so it's worth exploring what management has said about growth plans going forward.
The Bottom Line On Cheniere Energy's ROCE
As discussed above, Cheniere Energy appears to be getting more proficient at generating returns since capital employed has remained flat but earnings (before interest and tax) are up. And a remarkable 157% total return over the last five years tells us that investors are expecting more good things to come in the future. Therefore, we think it would be worth your time to check if these trends are going to continue.
One final note, you should learn about the 2 warning signs we've spotted with Cheniere Energy (including 1 which is potentially serious) .
If you'd like to see other companies earning high returns, check out our free list of companies earning high returns with solid balance sheets here.
Have feedback on this article? Concerned about the content? Get in touch with us directly. Alternatively, email editorial-team (at) simplywallst.com.
This article by Simply Wall St is general in nature. We provide commentary based on historical data and analyst forecasts only using an unbiased methodology and our articles are not intended to be financial advice. It does not constitute a recommendation to buy or sell any stock, and does not take account of your objectives, or your financial situation. We aim to bring you long-term focused analysis driven by fundamental data. Note that our analysis may not factor in the latest price-sensitive company announcements or qualitative material. Simply Wall St has no position in any stocks mentioned.
