
 Yahoo Finance
 Cheniere Energy (NYSE:LNG) Could Become A Multi-Bagger
If you're looking for a multi-bagger, there's a few things to keep an eye out for. One common approach is to try and find a company with returns on capital employed (ROCE) that are increasing, in conjunction with a growing amount of capital employed. This shows us that it's a compounding machine, able to continually reinvest its earnings back into the business and generate higher returns. Speaking of which, we noticed some great changes in Cheniere Energy's (NYSE:LNG) returns on capital, so let's have a look.
Return On Capital Employed (ROCE): What Is It?
For those who don't know, ROCE is a measure of a company's yearly pre-tax profit (its return), relative to the capital employed in the business. To calculate this metric for Cheniere Energy, this is the formula:
Return on Capital Employed = Earnings Before Interest and Tax (EBIT) ÷ (Total Assets - Current Liabilities)
0.24 = US$8.7b ÷ (US$43b - US$6.2b) (Based on the trailing twelve months to March 2024).
Therefore, Cheniere Energy has an ROCE of 24%. In absolute terms that's a great return and it's even better than the Oil and Gas industry average of 12%.
See our latest analysis for Cheniere Energy
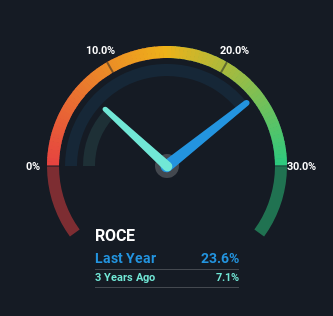
Above you can see how the current ROCE for Cheniere Energy compares to its prior returns on capital, but there's only so much you can tell from the past. If you'd like, you can check out the forecasts from the analysts covering Cheniere Energy for free.
So How Is Cheniere Energy's ROCE Trending?
Cheniere Energy has not disappointed with their ROCE growth. The figures show that over the last five years, ROCE has grown 296% whilst employing roughly the same amount of capital. So our take on this is that the business has increased efficiencies to generate these higher returns, all the while not needing to make any additional investments. It's worth looking deeper into this though because while it's great that the business is more efficient, it might also mean that going forward the areas to invest internally for the organic growth are lacking.
Our Take On Cheniere Energy's ROCE
In summary, we're delighted to see that Cheniere Energy has been able to increase efficiencies and earn higher rates of return on the same amount of capital. And with the stock having performed exceptionally well over the last five years, these patterns are being accounted for by investors. In light of that, we think it's worth looking further into this stock because if Cheniere Energy can keep these trends up, it could have a bright future ahead.
One more thing: We've identified 2 warning signs with Cheniere Energy (at least 1 which makes us a bit uncomfortable) , and understanding these would certainly be useful.
High returns are a key ingredient to strong performance, so check out our free list ofstocks earning high returns on equity with solid balance sheets.
Have feedback on this article? Concerned about the content? Get in touch with us directly. Alternatively, email editorial-team (at) simplywallst.com.
This article by Simply Wall St is general in nature. We provide commentary based on historical data and analyst forecasts only using an unbiased methodology and our articles are not intended to be financial advice. It does not constitute a recommendation to buy or sell any stock, and does not take account of your objectives, or your financial situation. We aim to bring you long-term focused analysis driven by fundamental data. Note that our analysis may not factor in the latest price-sensitive company announcements or qualitative material. Simply Wall St has no position in any stocks mentioned.
Have feedback on this article? Concerned about the content? Get in touch with us directly. Alternatively, email editorial-team@simplywallst.com
