
 Yahoo Finance
 Charter Communications (NASDAQ:CHTR) Takes On Some Risk With Its Use Of Debt

The external fund manager backed by Berkshire Hathaway's Charlie Munger, Li Lu, makes no bones about it when he says 'The biggest investment risk is not the volatility of prices, but whether you will suffer a permanent loss of capital. It's only natural to consider a company's balance sheet when you examine how risky it is, since debt is often involved when a business collapses. We note that Charter Communications, Inc. (NASDAQ:CHTR) does have debt on its balance sheet. But the more important question is: how much risk is that debt creating?
What Risk Does Debt Bring?
Generally speaking, debt only becomes a real problem when a company can't easily pay it off, either by raising capital or with its own cash flow. If things get really bad, the lenders can take control of the business. However, a more frequent (but still costly) occurrence is where a company must issue shares at bargain-basement prices, permanently diluting shareholders, just to shore up its balance sheet. Of course, plenty of companies use debt to fund growth, without any negative consequences. The first thing to do when considering how much debt a business uses is to look at its cash and debt together.
Check out our latest analysis for Charter Communications
What Is Charter Communications's Net Debt?
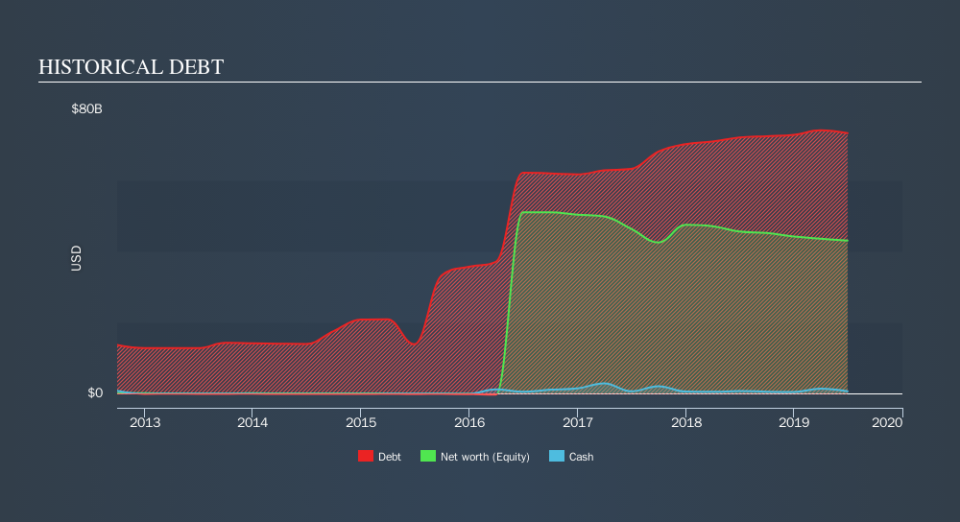
The chart below, which you can click on for greater detail, shows that Charter Communications had US$73.3b in debt in June 2019; about the same as the year before. Net debt is about the same, since the it doesn't have much cash.
How Healthy Is Charter Communications's Balance Sheet?
Zooming in on the latest balance sheet data, we can see that Charter Communications had liabilities of US$9.88b due within 12 months and liabilities of US$93.1b due beyond that. On the other hand, it had cash of US$696.0m and US$2.07b worth of receivables due within a year. So its liabilities total US$100.2b more than the combination of its cash and short-term receivables.
This deficit is considerable relative to its very significant market capitalization of US$101.7b, so it does suggest shareholders should keep an eye on Charter Communications's use of debt. This suggests shareholders would heavily diluted if the company needed to shore up its balance sheet in a hurry.
In order to size up a company's debt relative to its earnings, we calculate its net debt divided by its earnings before interest, tax, depreciation, and amortization (EBITDA) and its earnings before interest and tax (EBIT) divided by its interest expense (its interest cover). The advantage of this approach is that we take into account both the absolute quantum of debt (with net debt to EBITDA) and the actual interest expenses associated with that debt (with its interest cover ratio).
While Charter Communications's debt to EBITDA ratio (4.5) suggests that it uses some debt, its interest cover is very weak, at 1.7, suggesting high leverage. It seems that the business incurs large depreciation and amortisation charges, so maybe its debt load is heavier than it would first appear, since EBITDA is arguably a generous measure of earnings. It seems clear that the cost of borrowing money is negatively impacting returns for shareholders, of late. On the other hand, Charter Communications grew its EBIT by 29% in the last year. If it can maintain that kind of improvement, its debt load will begin to melt away like glaciers in a warming world. When analysing debt levels, the balance sheet is the obvious place to start. But it is future earnings, more than anything, that will determine Charter Communications's ability to maintain a healthy balance sheet going forward. So if you want to see what the professionals think, you might find this free report on analyst profit forecasts to be interesting.
Finally, while the tax-man may adore accounting profits, lenders only accept cold hard cash. So the logical step is to look at the proportion of that EBIT that is matched by actual free cash flow. During the last three years, Charter Communications produced sturdy free cash flow equating to 65% of its EBIT, about what we'd expect. This cold hard cash means it can reduce its debt when it wants to.
Our View
Neither Charter Communications's ability to cover its interest expense with its EBIT nor its net debt to EBITDA gave us confidence in its ability to take on more debt. But the good news is it seems to be able to grow its EBIT with ease. We think that Charter Communications's debt does make it a bit risky, after considering the aforementioned data points together. Not all risk is bad, as it can boost share price returns if it pays off, but this debt risk is worth keeping in mind. Given our hesitation about the stock, it would be good to know if Charter Communications insiders have sold any shares recently. You click here to find out if insiders have sold recently.
At the end of the day, it's often better to focus on companies that are free from net debt. You can access our special list of such companies (all with a track record of profit growth). It's free.
We aim to bring you long-term focused research analysis driven by fundamental data. Note that our analysis may not factor in the latest price-sensitive company announcements or qualitative material.
If you spot an error that warrants correction, please contact the editor at editorial-team@simplywallst.com. This article by Simply Wall St is general in nature. It does not constitute a recommendation to buy or sell any stock, and does not take account of your objectives, or your financial situation. Simply Wall St has no position in the stocks mentioned. Thank you for reading.
