
 Yahoo Finance
 Is CGI Inc. (TSE:GIB.A) A Financially Strong Company?

Want to participate in a short research study? Help shape the future of investing tools and you could win a $250 gift card!
CGI Inc. (TSE:GIB.A), a large-cap worth CA$28b, comes to mind for investors seeking a strong and reliable stock investment. Most investors favour these big stocks due to their strong balance sheet and high market liquidity, meaning there are an abundance of stock in the public market available for trading. In times of low liquidity in the market, these firms won’t be left high and dry. They are also relatively unaffected by increases in interest rates. Using the most recent data for GIB.A, I will determine its financial status based on its solvency and liquidity, and assess whether the stock is a safe investment.
View our latest analysis for CGI
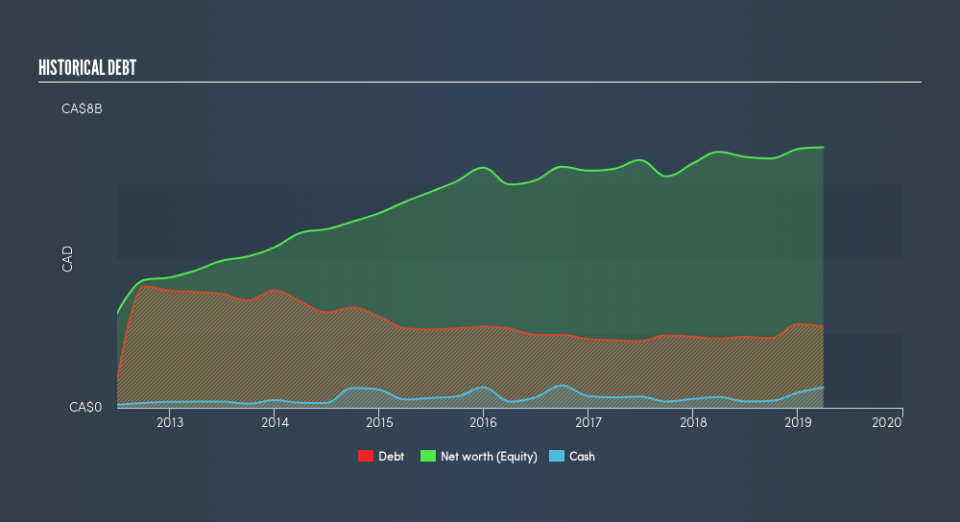
GIB.A’s Debt (And Cash Flows)
GIB.A's debt levels surged from CA$1.9b to CA$2.2b over the last 12 months , which includes long-term debt. With this growth in debt, GIB.A's cash and short-term investments stands at CA$544m , ready to be used for running the business. On top of this, GIB.A has produced cash from operations of CA$1.5b during the same period of time, leading to an operating cash to total debt ratio of 69%, indicating that GIB.A’s current level of operating cash is high enough to cover debt.
Does GIB.A’s liquid assets cover its short-term commitments?
With current liabilities at CA$3.1b, the company has maintained a safe level of current assets to meet its obligations, with the current ratio last standing at 1.16x. The current ratio is the number you get when you divide current assets by current liabilities. For IT companies, this ratio is within a sensible range since there's a sufficient cash cushion without leaving too much capital idle or in low-earning investments.
Is GIB.A’s debt level acceptable?
GIB.A’s level of debt is appropriate relative to its total equity, at 31%. GIB.A is not taking on too much debt commitment, which can be restrictive and risky for equity-holders. We can check to see whether GIB.A is able to meet its debt obligations by looking at the net interest coverage ratio. As a rule of thumb, a company should have earnings before interest and tax (EBIT) of at least three times the size of net interest. For GIB.A, the ratio of 29.93x suggests that interest is amply covered. It is considered a responsible and reassuring practice to maintain high interest coverage, which makes GIB.A and other large-cap investments thought to be safe.
Next Steps:
GIB.A has demonstrated its ability to generate sufficient levels of cash flow, while its debt hovers at an appropriate level. Furthermore, the company exhibits an ability to meet its near-term obligations, which isn't a big surprise for a large-cap. I admit this is a fairly basic analysis for GIB.A's financial health. Other important fundamentals need to be considered alongside. I recommend you continue to research CGI to get a better picture of the stock by looking at:
Future Outlook: What are well-informed industry analysts predicting for GIB.A’s future growth? Take a look at our free research report of analyst consensus for GIB.A’s outlook.
Valuation: What is GIB.A worth today? Is the stock undervalued, even when its growth outlook is factored into its intrinsic value? The intrinsic value infographic in our free research report helps visualize whether GIB.A is currently mispriced by the market.
Other High-Performing Stocks: Are there other stocks that provide better prospects with proven track records? Explore our free list of these great stocks here.
We aim to bring you long-term focused research analysis driven by fundamental data. Note that our analysis may not factor in the latest price-sensitive company announcements or qualitative material.
If you spot an error that warrants correction, please contact the editor at editorial-team@simplywallst.com. This article by Simply Wall St is general in nature. It does not constitute a recommendation to buy or sell any stock, and does not take account of your objectives, or your financial situation. Simply Wall St has no position in the stocks mentioned. Thank you for reading.
