
 Yahoo Finance
 CF Energy (CVE:CFY) Might Be Having Difficulty Using Its Capital Effectively
If we want to find a potential multi-bagger, often there are underlying trends that can provide clues. Firstly, we'll want to see a proven return on capital employed (ROCE) that is increasing, and secondly, an expanding base of capital employed. This shows us that it's a compounding machine, able to continually reinvest its earnings back into the business and generate higher returns. However, after investigating CF Energy (CVE:CFY), we don't think it's current trends fit the mold of a multi-bagger.
Understanding Return On Capital Employed (ROCE)
For those who don't know, ROCE is a measure of a company's yearly pre-tax profit (its return), relative to the capital employed in the business. To calculate this metric for CF Energy, this is the formula:
Return on Capital Employed = Earnings Before Interest and Tax (EBIT) ÷ (Total Assets - Current Liabilities)
0.06 = CN¥50m ÷ (CN¥1.3b - CN¥414m) (Based on the trailing twelve months to March 2022).
Thus, CF Energy has an ROCE of 6.0%. On its own, that's a low figure but it's around the 5.3% average generated by the Gas Utilities industry.
See our latest analysis for CF Energy
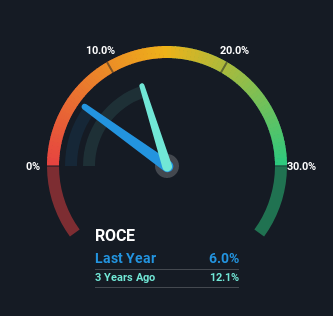
Historical performance is a great place to start when researching a stock so above you can see the gauge for CF Energy's ROCE against it's prior returns. If you're interested in investigating CF Energy's past further, check out this free graph of past earnings, revenue and cash flow.
What The Trend Of ROCE Can Tell Us
The trend of ROCE doesn't look fantastic because it's fallen from 21% five years ago, while the business's capital employed increased by 127%. Usually this isn't ideal, but given CF Energy conducted a capital raising before their most recent earnings announcement, that would've likely contributed, at least partially, to the increased capital employed figure. CF Energy probably hasn't received a full year of earnings yet from the new funds it raised, so these figures should be taken with a grain of salt.
On a side note, CF Energy has done well to pay down its current liabilities to 33% of total assets. So we could link some of this to the decrease in ROCE. What's more, this can reduce some aspects of risk to the business because now the company's suppliers or short-term creditors are funding less of its operations. Since the business is basically funding more of its operations with it's own money, you could argue this has made the business less efficient at generating ROCE.
What We Can Learn From CF Energy's ROCE
In summary, CF Energy is reinvesting funds back into the business for growth but unfortunately it looks like sales haven't increased much just yet. And in the last five years, the stock has given away 39% so the market doesn't look too hopeful on these trends strengthening any time soon. In any case, the stock doesn't have these traits of a multi-bagger discussed above, so if that's what you're looking for, we think you'd have more luck elsewhere.
CF Energy does come with some risks though, we found 4 warning signs in our investment analysis, and 3 of those are a bit concerning...
While CF Energy may not currently earn the highest returns, we've compiled a list of companies that currently earn more than 25% return on equity. Check out this free list here.
Have feedback on this article? Concerned about the content? Get in touch with us directly. Alternatively, email editorial-team (at) simplywallst.com.
This article by Simply Wall St is general in nature. We provide commentary based on historical data and analyst forecasts only using an unbiased methodology and our articles are not intended to be financial advice. It does not constitute a recommendation to buy or sell any stock, and does not take account of your objectives, or your financial situation. We aim to bring you long-term focused analysis driven by fundamental data. Note that our analysis may not factor in the latest price-sensitive company announcements or qualitative material. Simply Wall St has no position in any stocks mentioned.
Join A Paid User Research Session
You’ll receive a US$30 Amazon Gift card for 1 hour of your time while helping us build better investing tools for the individual investors like yourself. Sign up here
