
 Yahoo Finance
 Is Cervus Equipment Corporation’s (TSE:CERV) Balance Sheet Strong Enough To Weather A Storm?

While small-cap stocks, such as Cervus Equipment Corporation (TSE:CERV) with its market cap of CA$219.4m, are popular for their explosive growth, investors should also be aware of their balance sheet to judge whether the company can survive a downturn. Assessing first and foremost the financial health is essential, since poor capital management may bring about bankruptcies, which occur at a higher rate for small-caps. I believe these basic checks tell most of the story you need to know. Nevertheless, given that I have not delve into the company-specifics, I’d encourage you to dig deeper yourself into CERV here.
How does CERV’s operating cash flow stack up against its debt?
CERV’s debt levels surged from CA$185.7m to CA$240.5m over the last 12 months – this includes both the current and long-term debt. With this growth in debt, the current cash and short-term investment levels stands at CA$1.9m for investing into the business. Moreover, CERV has produced CA$6.9m in operating cash flow in the last twelve months, leading to an operating cash to total debt ratio of 2.9%, signalling that CERV’s current level of operating cash is not high enough to cover debt. This ratio can also be interpreted as a measure of efficiency as an alternative to return on assets. In CERV’s case, it is able to generate 0.029x cash from its debt capital.
Can CERV pay its short-term liabilities?
Looking at CERV’s most recent CA$292.2m liabilities, it appears that the company has been able to meet these obligations given the level of current assets of CA$448.6m, with a current ratio of 1.54x. Usually, for Trade Distributors companies, this is a suitable ratio since there is a bit of a cash buffer without leaving too much capital in a low-return environment.
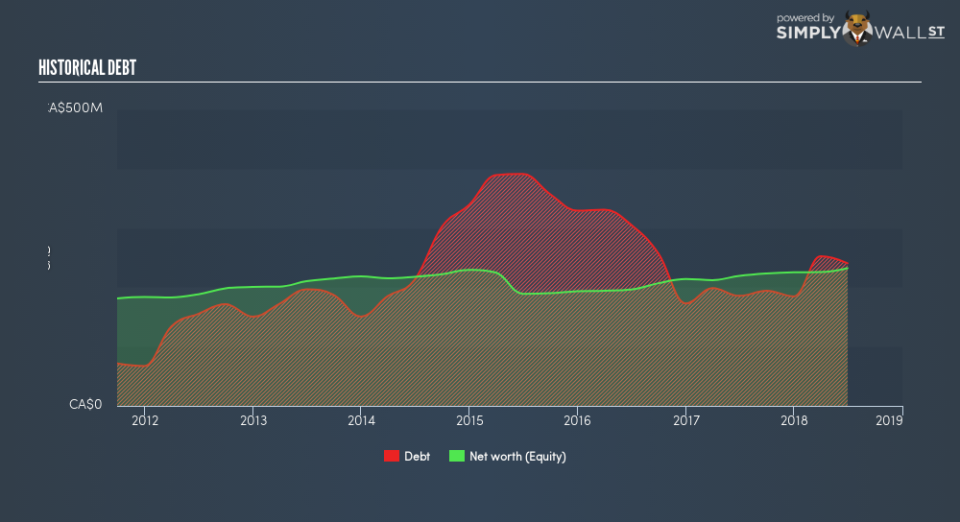
Is CERV’s debt level acceptable?
CERV is a highly-leveraged company with debt exceeding equity by over 100%. This is not uncommon for a small-cap company given that debt tends to be lower-cost and at times, more accessible. We can test if CERV’s debt levels are sustainable by measuring interest payments against earnings of a company. Ideally, earnings before interest and tax (EBIT) should cover net interest by at least three times. For CERV, the ratio of 6.54x suggests that interest is appropriately covered, which means that lenders may be inclined to lend more money to the company, as it is seen as safe in terms of payback.
Next Steps:
At its current level of cash flow coverage, CERV has room for improvement to better cushion for events which may require debt repayment. However, the company exhibits an ability to meet its near term obligations should an adverse event occur. I admit this is a fairly basic analysis for CERV’s financial health. Other important fundamentals need to be considered alongside. I suggest you continue to research Cervus Equipment to get a better picture of the stock by looking at:
Future Outlook: What are well-informed industry analysts predicting for CERV’s future growth? Take a look at our free research report of analyst consensus for CERV’s outlook.
Valuation: What is CERV worth today? Is the stock undervalued, even when its growth outlook is factored into its intrinsic value? The intrinsic value infographic in our free research report helps visualize whether CERV is currently mispriced by the market.
Other High-Performing Stocks: Are there other stocks that provide better prospects with proven track records? Explore our free list of these great stocks here.
To help readers see past the short term volatility of the financial market, we aim to bring you a long-term focused research analysis purely driven by fundamental data. Note that our analysis does not factor in the latest price-sensitive company announcements.
The author is an independent contributor and at the time of publication had no position in the stocks mentioned. For errors that warrant correction please contact the editor at editorial-team@simplywallst.com.
