
 Yahoo Finance
 Has Cervus Equipment Corporation (TSE:CERV) Improved Earnings In Recent Times?

Assessing Cervus Equipment Corporation’s (TSE:CERV) past track record of performance is a valuable exercise for investors. It enables us to reflect on whether the company has met or exceed expectations, which is a great indicator for future performance. Today I will assess CERV’s recent performance announced on 30 June 2018 and evaluate these figures to its longer term trend and industry movements.
Check out our latest analysis for Cervus Equipment
Was CERV weak performance lately part of a long-term decline?
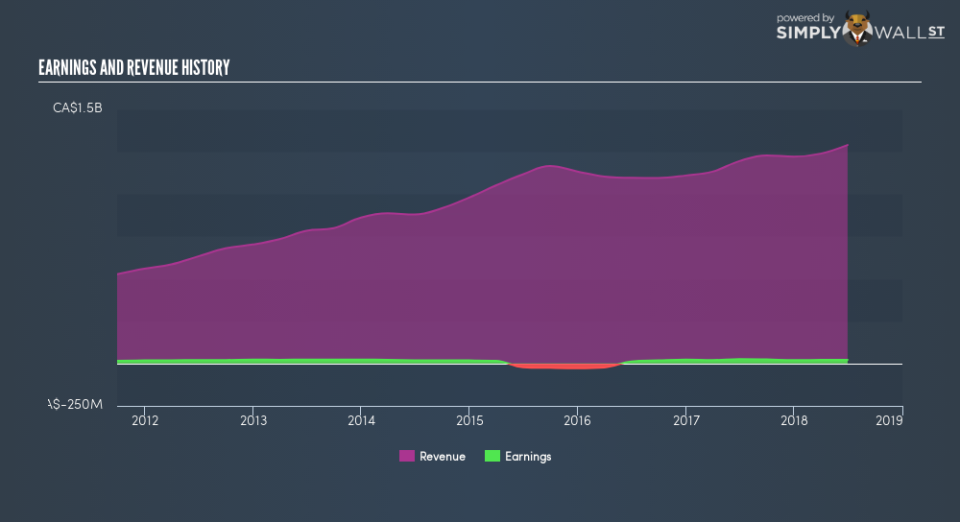
CERV’s trailing twelve-month earnings (from 30 June 2018) of CA$22.5m has declined by -14.0% compared to the previous year. Furthermore, this one-year growth rate has been lower than its average earnings growth rate over the past 5 years of -4.5%, indicating the rate at which CERV is growing has slowed down. What could be happening here? Let’s examine what’s transpiring with margins and whether the whole industry is facing the same headwind.
Revenue growth in the past couple of years, has been positive, nevertheless earnings growth has been falling. This implies that Cervus Equipment has been increasing expenses, which is harming margins and earnings, and is not a sustainable practice. Scanning growth from a sector-level, the Canadian trade distributors industry has been growing its average earnings by double-digit 28.1% in the prior year, . This is a change from a volatile drop of -4.4% in the previous couple of years. This growth is a median of profitable companies of 9 Trade Distributors companies in CA including Taiga Building Products, Hardwoods Distribution and Richelieu Hardware. This means that, in the recent industry expansion, Cervus Equipment has not been able to realize the gains unlike its industry peers.
In terms of returns from investment, Cervus Equipment has fallen short of achieving a 20% return on equity (ROE), recording 9.7% instead. Furthermore, its return on assets (ROA) of 5.0% is below the CA Trade Distributors industry of 5.8%, indicating Cervus Equipment’s are utilized less efficiently. However, its return on capital (ROC), which also accounts for Cervus Equipment’s debt level, has increased over the past 3 years from 5.6% to 12.0%.
What does this mean?
While past data is useful, it doesn’t tell the whole story. Companies that are profitable, but have unpredictable earnings, can have many factors affecting its business. I recommend you continue to research Cervus Equipment to get a more holistic view of the stock by looking at:
Future Outlook: What are well-informed industry analysts predicting for CERV’s future growth? Take a look at our free research report of analyst consensus for CERV’s outlook.
Financial Health: Are CERV’s operations financially sustainable? Balance sheets can be hard to analyze, which is why we’ve done it for you. Check out our financial health checks here.
Other High-Performing Stocks: Are there other stocks that provide better prospects with proven track records? Explore our free list of these great stocks here.
NB: Figures in this article are calculated using data from the trailing twelve months from 30 June 2018. This may not be consistent with full year annual report figures.
To help readers see past the short term volatility of the financial market, we aim to bring you a long-term focused research analysis purely driven by fundamental data. Note that our analysis does not factor in the latest price-sensitive company announcements.
The author is an independent contributor and at the time of publication had no position in the stocks mentioned. For errors that warrant correction please contact the editor at editorial-team@simplywallst.com.
