
 Yahoo Finance
 Do You Like Centrica plc (LON:CNA) At This P/E Ratio?

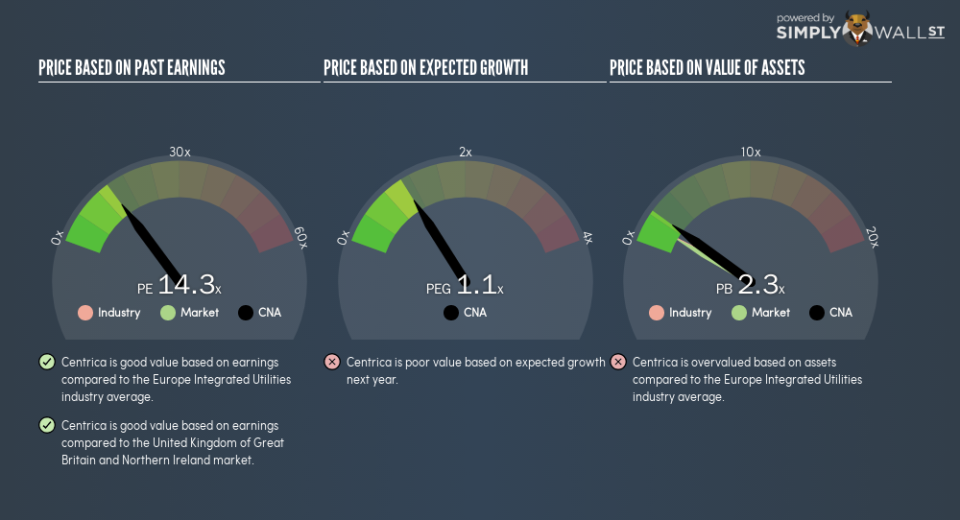
The goal of this article is to teach you how to use price to earnings ratios (P/E ratios). We’ll show how you can use Centrica plc’s (LON:CNA) P/E ratio to inform your assessment of the investment opportunity. Based on the last twelve months, Centrica’s P/E ratio is 14.34. That corresponds to an earnings yield of approximately 7.0%.
See our latest analysis for Centrica
How Do I Calculate A Price To Earnings Ratio?
The formula for P/E is:
Price to Earnings Ratio = Share Price ÷ Earnings per Share (EPS)
Or for Centrica:
P/E of 14.34 = £1.36 ÷ £0.095 (Based on the trailing twelve months to June 2018.)
Is A High P/E Ratio Good?
A higher P/E ratio implies that investors pay a higher price for the earning power of the business. That isn’t a good or a bad thing on its own, but a high P/E means that buyers have a higher opinion of the business’s prospects, relative to stocks with a lower P/E.
How Growth Rates Impact P/E Ratios
Probably the most important factor in determining what P/E a company trades on is the earnings growth. Earnings growth means that in the future the ‘E’ will be higher. Therefore, even if you pay a high multiple of earnings now, that multiple will become lower in the future. Then, a lower P/E should attract more buyers, pushing the share price up.
Centrica’s earnings per share fell by 8.5% in the last twelve months. But over the longer term (3 years), earnings per share have increased by 72%.
How Does Centrica’s P/E Ratio Compare To Its Peers?
The P/E ratio essentially measures market expectations of a company. The image below shows that Centrica has a P/E ratio that is roughly in line with the integrated utilities industry average (14.5).
That indicates that the market expects Centrica will perform roughly in line with other companies in its industry. The company could surprise by performing better than average, in the future. Further research into factors such asmanagement tenure, could help you form your own view on whether that is likely.
A Limitation: P/E Ratios Ignore Debt and Cash In The Bank
Don’t forget that the P/E ratio considers market capitalization. Thus, the metric does not reflect cash or debt held by the company. In theory, a company can lower its future P/E ratio by using cash or debt to invest in growth.
Such spending might be good or bad, overall, but the key point here is that you need to look at debt to understand the P/E ratio in context.
Centrica’s Balance Sheet
Centrica has net debt worth 47% of its market capitalization. This is a reasonably significant level of debt — all else being equal you’d expect a much lower P/E than if it had net cash.
The Bottom Line On Centrica’s P/E Ratio
Centrica trades on a P/E ratio of 14.3, which is fairly close to the GB market average of 14.7. When you consider the lack of EPS growth last year (along with some debt), it seems the market is optimistic about the future for the business.
Investors should be looking to buy stocks that the market is wrong about. If the reality for a company is not as bad as the P/E ratio indicates, then the share price should increase as the market realizes this. So this free visualization of the analyst consensus on future earnings could help you make the right decision about whether to buy, sell, or hold.
But note: Centrica may not be the best stock to buy. So take a peek at this free list of interesting companies with strong recent earnings growth (and a P/E ratio below 20).
To help readers see past the short term volatility of the financial market, we aim to bring you a long-term focused research analysis purely driven by fundamental data. Note that our analysis does not factor in the latest price-sensitive company announcements.
The author is an independent contributor and at the time of publication had no position in the stocks mentioned. For errors that warrant correction please contact the editor at editorial-team@simplywallst.com.