
 Yahoo Finance
 Has Centrica plc’s (LON:CNA) Earnings Momentum Changed Recently?

Understanding Centrica plc’s (LON:CNA) performance as a company requires examining more than earnings from one point in time. Today I will take you through a basic sense check to gain perspective on how Centrica is doing by evaluating its latest earnings with its longer term trend as well as its industry peers’ performance over the same period.
Check out our latest analysis for Centrica
How Did CNA’s Recent Performance Stack Up Against Its Past?
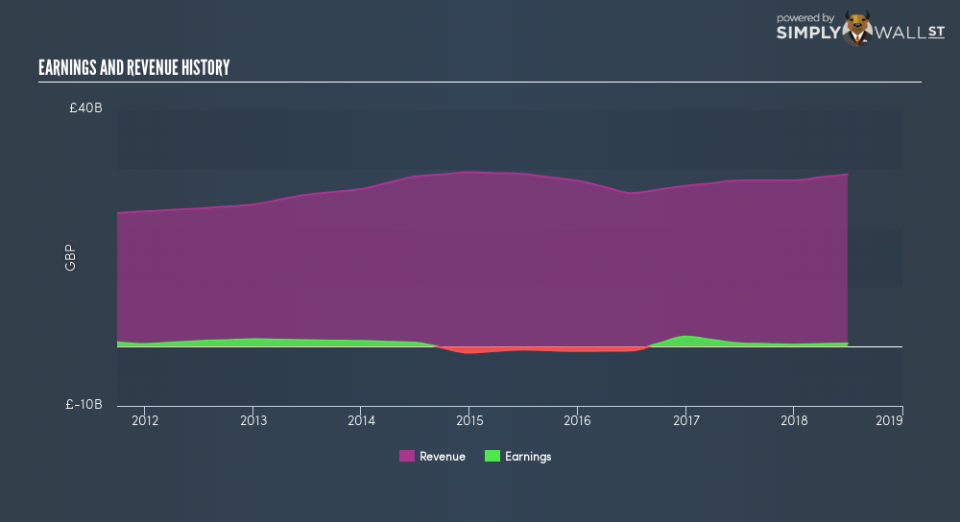
CNA’s trailing twelve-month earnings (from 30 June 2018) of UK£529.0m has declined by -6.5% compared to the previous year. Furthermore, this one-year growth rate has been lower than its average earnings growth rate over the past 5 years of -12.4%, indicating the rate at which CNA is growing has slowed down. Why is this? Well, let’s take a look at what’s transpiring with margins and whether the rest of the industry is facing the same headwind.
Revenue growth in the last couple of years, has been positive, however earnings growth has been declining. This suggest that Centrica has been growing expenses, which is hurting margins and earnings, and is not a sustainable practice. Scanning growth from a sector-level, the UK integrated utilities industry has been relatively flat in terms of earnings growth over the past couple of years. Since the Integrated Utilities sector in GB is relatively small, I’ve included similar companies in the wider region in order to get a better idea of the growth, which is a median of profitable companies of companies such as Telecom Plus, National Grid and . This shows that whatever near-term headwind the industry is experiencing, it’s hitting Centrica harder than its peers.
In terms of returns from investment, Centrica has fallen short of achieving a 20% return on equity (ROE), recording 13.3% instead. However, its return on assets (ROA) of 4.2% exceeds the GB Integrated Utilities industry of 3.7%, indicating Centrica has used its assets more efficiently. Though, its return on capital (ROC), which also accounts for Centrica’s debt level, has declined over the past 3 years from 9.1% to 6.8%. This correlates with an increase in debt holding, with debt-to-equity ratio rising from 92.4% to 132% over the past 5 years.
What does this mean?
While past data is useful, it doesn’t tell the whole story. Companies that are profitable, but have unpredictable earnings, can have many factors influencing its business. I suggest you continue to research Centrica to get a more holistic view of the stock by looking at:
Future Outlook: What are well-informed industry analysts predicting for CNA’s future growth? Take a look at our free research report of analyst consensus for CNA’s outlook.
Financial Health: Are CNA’s operations financially sustainable? Balance sheets can be hard to analyze, which is why we’ve done it for you. Check out our financial health checks here.
Other High-Performing Stocks: Are there other stocks that provide better prospects with proven track records? Explore our free list of these great stocks here.
NB: Figures in this article are calculated using data from the trailing twelve months from 30 June 2018. This may not be consistent with full year annual report figures.
To help readers see past the short term volatility of the financial market, we aim to bring you a long-term focused research analysis purely driven by fundamental data. Note that our analysis does not factor in the latest price-sensitive company announcements.
The author is an independent contributor and at the time of publication had no position in the stocks mentioned. For errors that warrant correction please contact the editor at editorial-team@simplywallst.com.
