
 Yahoo Finance
 Is Celestica Inc. (TSE:CLS) Investing Your Capital Efficiently?

Today we’ll look at Celestica Inc. (TSE:CLS) and reflect on its potential as an investment. In particular, we’ll consider its Return On Capital Employed (ROCE), as that can give us insight into how profitably the company is able to employ capital in its business.
Firstly, we’ll go over how we calculate ROCE. Then we’ll compare its ROCE to similar companies. Finally, we’ll look at how its current liabilities affect its ROCE.
Understanding Return On Capital Employed (ROCE)
ROCE is a metric for evaluating how much pre-tax income (in percentage terms) a company earns on the capital invested in its business. Generally speaking a higher ROCE is better. Overall, it is a valuable metric that has its flaws. Author Edwin Whiting says to be careful when comparing the ROCE of different businesses, since ‘No two businesses are exactly alike.’
So, How Do We Calculate ROCE?
The formula for calculating the return on capital employed is:
Return on Capital Employed = Earnings Before Interest and Tax (EBIT) ÷ (Total Assets – Current Liabilities)
Or for Celestica:
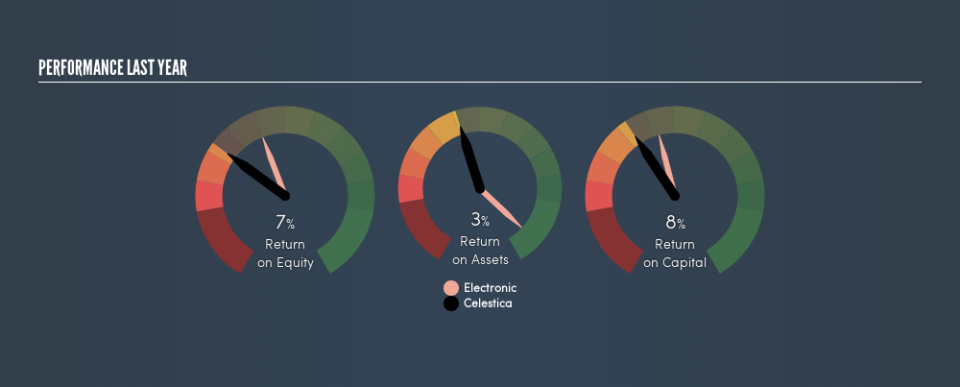
0.08 = US$169m ÷ (US$3.7b – US$1.6b) (Based on the trailing twelve months to December 2018.)
Therefore, Celestica has an ROCE of 8.0%.
Check out our latest analysis for Celestica
Is Celestica’s ROCE Good?
ROCE can be useful when making comparisons, such as between similar companies. We can see Celestica’s ROCE is meaningfully below the Electronic industry average of 19%. This performance is not ideal, as it suggests the company may not be deploying its capital as effectively as some competitors. Separate from how Celestica stacks up against its industry, its ROCE in absolute terms is mediocre; relative to the returns on government bonds. Investors may wish to consider higher-performing investments.
Remember that this metric is backwards looking – it shows what has happened in the past, and does not accurately predict the future. ROCE can be misleading for companies in cyclical industries, with returns looking impressive during the boom times, but very weak during the busts. This is because ROCE only looks at one year, instead of considering returns across a whole cycle. Future performance is what matters, and you can see analyst predictions in our free report on analyst forecasts for the company.
How Celestica’s Current Liabilities Impact Its ROCE
Current liabilities include invoices, such as supplier payments, short-term debt, or a tax bill, that need to be paid within 12 months. The ROCE equation subtracts current liabilities from capital employed, so a company with a lot of current liabilities appears to have less capital employed, and a higher ROCE than otherwise. To check the impact of this, we calculate if a company has high current liabilities relative to its total assets.
Celestica has total liabilities of US$1.6b and total assets of US$3.7b. As a result, its current liabilities are equal to approximately 43% of its total assets. Celestica’s ROCE is improved somewhat by its moderate amount of current liabilities.
What We Can Learn From Celestica’s ROCE
Unfortunately, its ROCE is still uninspiring, and there are potentially more attractive prospects out there. But note: Celestica may not be the best stock to buy. So take a peek at this free list of interesting companies with strong recent earnings growth (and a P/E ratio below 20).
For those who like to find winning investments this free list of growing companies with recent insider purchasing, could be just the ticket.
We aim to bring you long-term focused research analysis driven by fundamental data. Note that our analysis may not factor in the latest price-sensitive company announcements or qualitative material.
If you spot an error that warrants correction, please contact the editor at editorial-team@simplywallst.com. This article by Simply Wall St is general in nature. It does not constitute a recommendation to buy or sell any stock, and does not take account of your objectives, or your financial situation. Simply Wall St has no position in the stocks mentioned. Thank you for reading.
