
 Yahoo Finance
 Ceapro (CVE:CZO) Has More To Do To Multiply In Value Going Forward
If you're looking for a multi-bagger, there's a few things to keep an eye out for. In a perfect world, we'd like to see a company investing more capital into its business and ideally the returns earned from that capital are also increasing. If you see this, it typically means it's a company with a great business model and plenty of profitable reinvestment opportunities. With that in mind, the ROCE of Ceapro (CVE:CZO) looks decent, right now, so lets see what the trend of returns can tell us.
What is Return On Capital Employed (ROCE)?
For those that aren't sure what ROCE is, it measures the amount of pre-tax profits a company can generate from the capital employed in its business. Analysts use this formula to calculate it for Ceapro:
Return on Capital Employed = Earnings Before Interest and Tax (EBIT) ÷ (Total Assets - Current Liabilities)
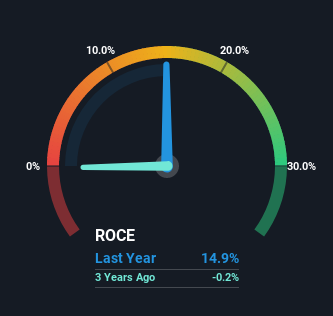
0.15 = CA$4.7m ÷ (CA$33m - CA$850k) (Based on the trailing twelve months to March 2022).
So, Ceapro has an ROCE of 15%. That's a relatively normal return on capital, and it's around the 16% generated by the Chemicals industry.
View our latest analysis for Ceapro
While the past is not representative of the future, it can be helpful to know how a company has performed historically, which is why we have this chart above. If you want to delve into the historical earnings, revenue and cash flow of Ceapro, check out these free graphs here.
What Does the ROCE Trend For Ceapro Tell Us?
The trend of ROCE doesn't stand out much, but returns on a whole are decent. The company has consistently earned 15% for the last five years, and the capital employed within the business has risen 30% in that time. Since 15% is a moderate ROCE though, it's good to see a business can continue to reinvest at these decent rates of return. Over long periods of time, returns like these might not be too exciting, but with consistency they can pay off in terms of share price returns.
The Bottom Line On Ceapro's ROCE
The main thing to remember is that Ceapro has proven its ability to continually reinvest at respectable rates of return. However, despite the favorable fundamentals, the stock has fallen 41% over the last five years, so there might be an opportunity here for astute investors. For that reason, savvy investors might want to look further into this company in case it's a prime investment.
One more thing to note, we've identified 2 warning signs with Ceapro and understanding them should be part of your investment process.
While Ceapro may not currently earn the highest returns, we've compiled a list of companies that currently earn more than 25% return on equity. Check out this free list here.
Have feedback on this article? Concerned about the content? Get in touch with us directly. Alternatively, email editorial-team (at) simplywallst.com.
This article by Simply Wall St is general in nature. We provide commentary based on historical data and analyst forecasts only using an unbiased methodology and our articles are not intended to be financial advice. It does not constitute a recommendation to buy or sell any stock, and does not take account of your objectives, or your financial situation. We aim to bring you long-term focused analysis driven by fundamental data. Note that our analysis may not factor in the latest price-sensitive company announcements or qualitative material. Simply Wall St has no position in any stocks mentioned.
