
 Yahoo Finance
 How CBL & Associates Properties, Inc. (NYSE:CBL) Can Impact Your Portfolio Volatility

If you're interested in CBL & Associates Properties, Inc. (NYSE:CBL), then you might want to consider its beta (a measure of share price volatility) in order to understand how the stock could impact your portfolio. Modern finance theory considers volatility to be a measure of risk, and there are two main types of price volatility. The first category is company specific volatility. This can be dealt with by limiting your exposure to any particular stock. The second type is the broader market volatility, which you cannot diversify away, since it arises from macroeconomic factors which directly affects all the stocks on the market.
Some stocks mimic the volatility of the market quite closely, while others demonstrate muted, exagerrated or uncorrelated price movements. Beta can be a useful tool to understand how much a stock is influenced by market risk (volatility). However, Warren Buffett said 'volatility is far from synonymous with risk' in his 2014 letter to investors. So, while useful, beta is not the only metric to consider. To use beta as an investor, you must first understand that the overall market has a beta of one. A stock with a beta below one is either less volatile than the market, or more volatile but not corellated with the overall market. In comparison a stock with a beta of over one tends to be move in a similar direction to the market in the long term, but with greater changes in price.
View our latest analysis for CBL & Associates Properties
What CBL's beta value tells investors
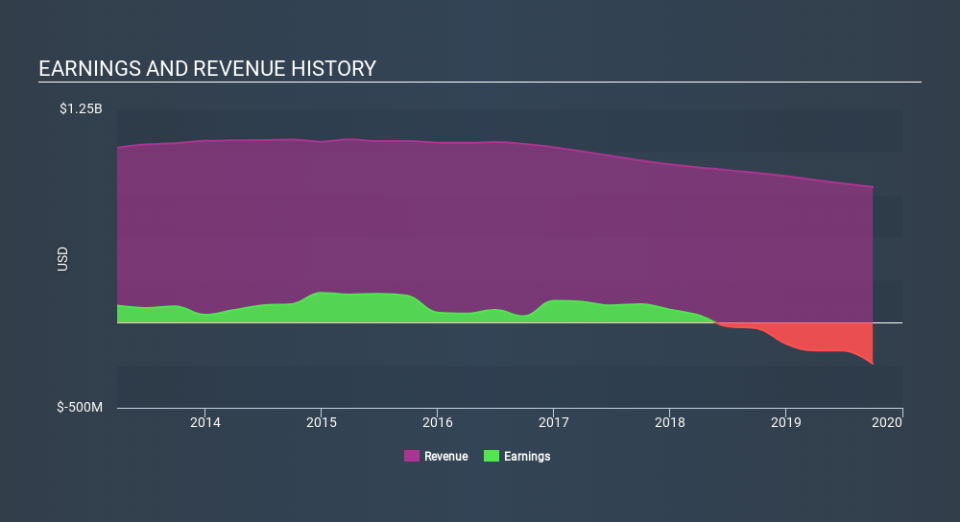
Looking at the last five years, CBL & Associates Properties has a beta of 1.62. The fact that this is well above 1 indicates that its share price movements have shown sensitivity to overall market volatility. If this beta value holds true in the future, CBL & Associates Properties shares are likely to rise more than the market when the market is going up, but fall faster when the market is going down. Beta is worth considering, but it's also important to consider whether CBL & Associates Properties is growing earnings and revenue. You can take a look for yourself, below.
How does CBL's size impact its beta?
CBL & Associates Properties is a noticeably small company, with a market capitalisation of US$204m. Most companies this size are not always actively traded. Relatively few investors can influence the price of a smaller company, compared to a large company. This could explain the high beta value, in this case.
What this means for you:
Since CBL & Associates Properties tends to moves up when the market is going up, and down when it's going down, potential investors may wish to reflect on the overall market, when considering the stock. This article aims to educate investors about beta values, but it's well worth looking at important company-specific fundamentals such as CBL & Associates Properties’s financial health and performance track record. I urge you to continue your research by taking a look at the following:
Future Outlook: What are well-informed industry analysts predicting for CBL’s future growth? Take a look at our free research report of analyst consensus for CBL’s outlook.
Past Track Record: Has CBL been consistently performing well irrespective of the ups and downs in the market? Go into more detail in the past performance analysis and take a look at the free visual representations of CBL's historicals for more clarity.
Other Interesting Stocks: It's worth checking to see how CBL measures up against other companies on valuation. You could start with this free list of prospective options.
If you spot an error that warrants correction, please contact the editor at editorial-team@simplywallst.com. This article by Simply Wall St is general in nature. It does not constitute a recommendation to buy or sell any stock, and does not take account of your objectives, or your financial situation. Simply Wall St has no position in the stocks mentioned.
We aim to bring you long-term focused research analysis driven by fundamental data. Note that our analysis may not factor in the latest price-sensitive company announcements or qualitative material. Thank you for reading.
