
 Yahoo Finance
 Carter's' (NYSE:CRI) investors will be pleased with their 27% return over the last year
On average, over time, stock markets tend to rise higher. This makes investing attractive. But if when you choose to buy stocks, some of them will be below average performers. Over the last year the Carter's, Inc. (NYSE:CRI) share price is up 21%, but that's less than the broader market return. In contrast, the longer term returns are negative, since the share price is 5.7% lower than it was three years ago.
Let's take a look at the underlying fundamentals over the longer term, and see if they've been consistent with shareholders returns.
View our latest analysis for Carter's
In his essay The Superinvestors of Graham-and-Doddsville Warren Buffett described how share prices do not always rationally reflect the value of a business. One way to examine how market sentiment has changed over time is to look at the interaction between a company's share price and its earnings per share (EPS).
During the last year, Carter's actually saw its earnings per share drop 1.7%.
We don't think that the decline in earnings per share is a good measure of the business over the last twelve months. Since the change in EPS doesn't seem to correlate with the change in share price, it's worth taking a look at other metrics.
Unfortunately Carter's' fell 8.4% over twelve months. So using a snapshot of key business metrics doesn't give us a good picture of why the market is bidding up the stock.
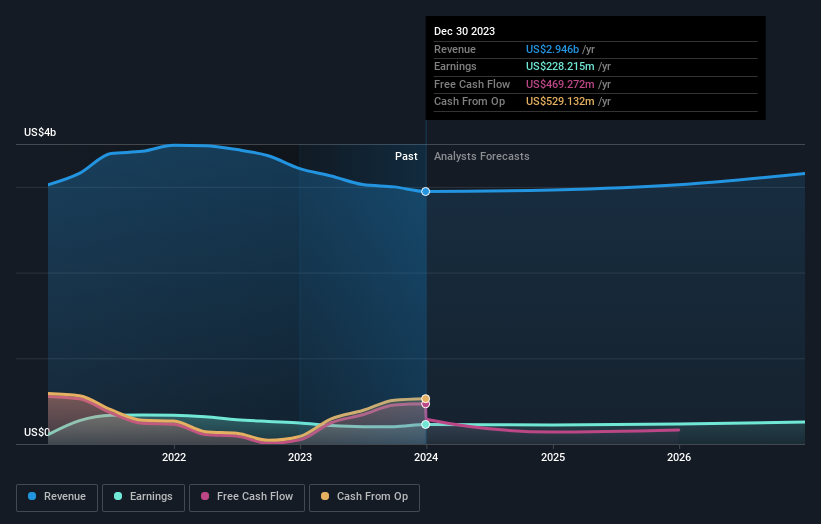
You can see how earnings and revenue have changed over time in the image below (click on the chart to see the exact values).
We know that Carter's has improved its bottom line over the last three years, but what does the future have in store? Take a more thorough look at Carter's' financial health with this free report on its balance sheet.
What About Dividends?
As well as measuring the share price return, investors should also consider the total shareholder return (TSR). The TSR incorporates the value of any spin-offs or discounted capital raisings, along with any dividends, based on the assumption that the dividends are reinvested. Arguably, the TSR gives a more comprehensive picture of the return generated by a stock. In the case of Carter's, it has a TSR of 27% for the last 1 year. That exceeds its share price return that we previously mentioned. This is largely a result of its dividend payments!
A Different Perspective
Carter's shareholders gained a total return of 27% during the year. But that return falls short of the market. But at least that's still a gain! Over five years the TSR has been a reduction of 1.2% per year, over five years. So this might be a sign the business has turned its fortunes around. While it is well worth considering the different impacts that market conditions can have on the share price, there are other factors that are even more important. Even so, be aware that Carter's is showing 1 warning sign in our investment analysis , you should know about...
If you like to buy stocks alongside management, then you might just love this free list of companies. (Hint: insiders have been buying them).
Please note, the market returns quoted in this article reflect the market weighted average returns of stocks that currently trade on American exchanges.
Have feedback on this article? Concerned about the content? Get in touch with us directly. Alternatively, email editorial-team (at) simplywallst.com.
This article by Simply Wall St is general in nature. We provide commentary based on historical data and analyst forecasts only using an unbiased methodology and our articles are not intended to be financial advice. It does not constitute a recommendation to buy or sell any stock, and does not take account of your objectives, or your financial situation. We aim to bring you long-term focused analysis driven by fundamental data. Note that our analysis may not factor in the latest price-sensitive company announcements or qualitative material. Simply Wall St has no position in any stocks mentioned.
