
 Yahoo Finance
 Cargojet (TSE:CJT) sheds 5.2% this week, as yearly returns fall more in line with earnings growth
The worst result, after buying shares in a company (assuming no leverage), would be if you lose all the money you put in. But when you pick a company that is really flourishing, you can make more than 100%. For instance, the price of Cargojet Inc. (TSE:CJT) stock is up an impressive 143% over the last five years. But it's down 5.2% in the last week.
Since the long term performance has been good but there's been a recent pullback of 5.2%, let's check if the fundamentals match the share price.
View our latest analysis for Cargojet
While markets are a powerful pricing mechanism, share prices reflect investor sentiment, not just underlying business performance. One imperfect but simple way to consider how the market perception of a company has shifted is to compare the change in the earnings per share (EPS) with the share price movement.
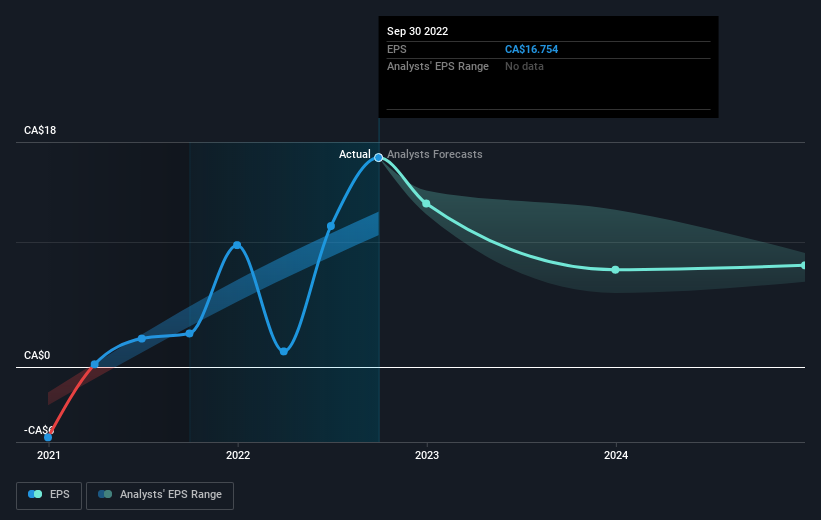
Over half a decade, Cargojet managed to grow its earnings per share at 75% a year. The EPS growth is more impressive than the yearly share price gain of 19% over the same period. Therefore, it seems the market has become relatively pessimistic about the company. This cautious sentiment is reflected in its (fairly low) P/E ratio of 7.80.
The company's earnings per share (over time) is depicted in the image below (click to see the exact numbers).
We like that insiders have been buying shares in the last twelve months. Even so, future earnings will be far more important to whether current shareholders make money. It might be well worthwhile taking a look at our free report on Cargojet's earnings, revenue and cash flow.
What About Dividends?
When looking at investment returns, it is important to consider the difference between total shareholder return (TSR) and share price return. Whereas the share price return only reflects the change in the share price, the TSR includes the value of dividends (assuming they were reinvested) and the benefit of any discounted capital raising or spin-off. It's fair to say that the TSR gives a more complete picture for stocks that pay a dividend. We note that for Cargojet the TSR over the last 5 years was 154%, which is better than the share price return mentioned above. And there's no prize for guessing that the dividend payments largely explain the divergence!
A Different Perspective
Investors in Cargojet had a tough year, with a total loss of 18% (including dividends), against a market gain of about 4.9%. However, keep in mind that even the best stocks will sometimes underperform the market over a twelve month period. On the bright side, long term shareholders have made money, with a gain of 21% per year over half a decade. If the fundamental data continues to indicate long term sustainable growth, the current sell-off could be an opportunity worth considering. It's always interesting to track share price performance over the longer term. But to understand Cargojet better, we need to consider many other factors. Even so, be aware that Cargojet is showing 3 warning signs in our investment analysis , and 2 of those are potentially serious...
If you like to buy stocks alongside management, then you might just love this free list of companies. (Hint: insiders have been buying them).
Please note, the market returns quoted in this article reflect the market weighted average returns of stocks that currently trade on CA exchanges.
Have feedback on this article? Concerned about the content? Get in touch with us directly. Alternatively, email editorial-team (at) simplywallst.com.
This article by Simply Wall St is general in nature. We provide commentary based on historical data and analyst forecasts only using an unbiased methodology and our articles are not intended to be financial advice. It does not constitute a recommendation to buy or sell any stock, and does not take account of your objectives, or your financial situation. We aim to bring you long-term focused analysis driven by fundamental data. Note that our analysis may not factor in the latest price-sensitive company announcements or qualitative material. Simply Wall St has no position in any stocks mentioned.
Join A Paid User Research Session
You’ll receive a US$30 Amazon Gift card for 1 hour of your time while helping us build better investing tools for the individual investors like yourself. Sign up here
