
 Yahoo Finance
 Take Care Before Diving Into The Deep End On Cenntro Electric Group Limited (NASDAQ:CENN)
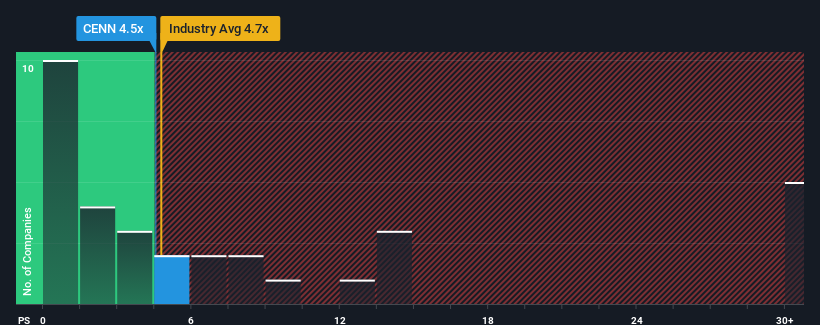
There wouldn't be many who think Cenntro Electric Group Limited's (NASDAQ:CENN) price-to-sales (or "P/S") ratio of 4.5x is worth a mention when the median P/S for the Auto industry in the United States is similar at about 4.7x. However, investors might be overlooking a clear opportunity or potential setback if there is no rational basis for the P/S.
View our latest analysis for Cenntro Electric Group
How Has Cenntro Electric Group Performed Recently?
Recent times have been quite advantageous for Cenntro Electric Group as its revenue has been rising very briskly. The P/S is probably moderate because investors think this strong revenue growth might not be enough to outperform the broader industry in the near future. Those who are bullish on Cenntro Electric Group will be hoping that this isn't the case, so that they can pick up the stock at a lower valuation.
Want the full picture on earnings, revenue and cash flow for the company? Then our free report on Cenntro Electric Group will help you shine a light on its historical performance.
Do Revenue Forecasts Match The P/S Ratio?
Cenntro Electric Group's P/S ratio would be typical for a company that's only expected to deliver moderate growth, and importantly, perform in line with the industry.
Retrospectively, the last year delivered an exceptional 52% gain to the company's top line. The strong recent performance means it was also able to grow revenue by 180% in total over the last three years. Accordingly, shareholders would have definitely welcomed those medium-term rates of revenue growth.
Comparing that recent medium-term revenue trajectory with the industry's one-year growth forecast of 26% shows it's noticeably more attractive.
With this information, we find it interesting that Cenntro Electric Group is trading at a fairly similar P/S compared to the industry. It may be that most investors are not convinced the company can maintain its recent growth rates.
The Final Word
While the price-to-sales ratio shouldn't be the defining factor in whether you buy a stock or not, it's quite a capable barometer of revenue expectations.
To our surprise, Cenntro Electric Group revealed its three-year revenue trends aren't contributing to its P/S as much as we would have predicted, given they look better than current industry expectations. It'd be fair to assume that potential risks the company faces could be the contributing factor to the lower than expected P/S. At least the risk of a price drop looks to be subdued if recent medium-term revenue trends continue, but investors seem to think future revenue could see some volatility.
It's always necessary to consider the ever-present spectre of investment risk. We've identified 5 warning signs with Cenntro Electric Group (at least 2 which are a bit concerning), and understanding these should be part of your investment process.
If companies with solid past earnings growth is up your alley, you may wish to see this free collection of other companies with strong earnings growth and low P/E ratios.
Have feedback on this article? Concerned about the content? Get in touch with us directly. Alternatively, email editorial-team (at) simplywallst.com.
This article by Simply Wall St is general in nature. We provide commentary based on historical data and analyst forecasts only using an unbiased methodology and our articles are not intended to be financial advice. It does not constitute a recommendation to buy or sell any stock, and does not take account of your objectives, or your financial situation. We aim to bring you long-term focused analysis driven by fundamental data. Note that our analysis may not factor in the latest price-sensitive company announcements or qualitative material. Simply Wall St has no position in any stocks mentioned.
