
 Yahoo Finance
 Capital Investments At AutoZone (NYSE:AZO) Point To A Promising Future
There are a few key trends to look for if we want to identify the next multi-bagger. Amongst other things, we'll want to see two things; firstly, a growing return on capital employed (ROCE) and secondly, an expansion in the company's amount of capital employed. Ultimately, this demonstrates that it's a business that is reinvesting profits at increasing rates of return. That's why when we briefly looked at AutoZone's (NYSE:AZO) ROCE trend, we were very happy with what we saw.
Understanding Return On Capital Employed (ROCE)
Just to clarify if you're unsure, ROCE is a metric for evaluating how much pre-tax income (in percentage terms) a company earns on the capital invested in its business. Analysts use this formula to calculate it for AutoZone:
Return on Capital Employed = Earnings Before Interest and Tax (EBIT) ÷ (Total Assets - Current Liabilities)
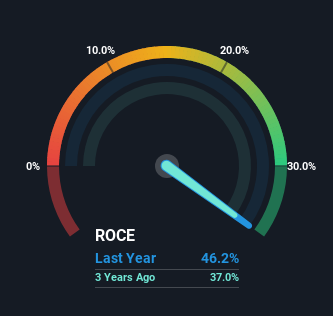
0.46 = US$3.7b ÷ (US$17b - US$8.8b) (Based on the trailing twelve months to February 2024).
Therefore, AutoZone has an ROCE of 46%. In absolute terms that's a great return and it's even better than the Specialty Retail industry average of 13%.
See our latest analysis for AutoZone
In the above chart we have measured AutoZone's prior ROCE against its prior performance, but the future is arguably more important. If you'd like to see what analysts are forecasting going forward, you should check out our free analyst report for AutoZone .
What Does the ROCE Trend For AutoZone Tell Us?
It's hard not to be impressed by AutoZone's returns on capital. The company has consistently earned 46% for the last five years, and the capital employed within the business has risen 80% in that time. Now considering ROCE is an attractive 46%, this combination is actually pretty appealing because it means the business can consistently put money to work and generate these high returns. If these trends can continue, it wouldn't surprise us if the company became a multi-bagger.
On a separate but related note, it's important to know that AutoZone has a current liabilities to total assets ratio of 52%, which we'd consider pretty high. This effectively means that suppliers (or short-term creditors) are funding a large portion of the business, so just be aware that this can introduce some elements of risk. While it's not necessarily a bad thing, it can be beneficial if this ratio is lower.
The Key Takeaway
AutoZone has demonstrated its proficiency by generating high returns on increasing amounts of capital employed, which we're thrilled about. And long term investors would be thrilled with the 188% return they've received over the last five years. So even though the stock might be more "expensive" than it was before, we think the strong fundamentals warrant this stock for further research.
If you want to know some of the risks facing AutoZone we've found 2 warning signs (1 makes us a bit uncomfortable!) that you should be aware of before investing here.
If you want to search for more stocks that have been earning high returns, check out this free list of stocks with solid balance sheets that are also earning high returns on equity.
Have feedback on this article? Concerned about the content? Get in touch with us directly. Alternatively, email editorial-team (at) simplywallst.com.
This article by Simply Wall St is general in nature. We provide commentary based on historical data and analyst forecasts only using an unbiased methodology and our articles are not intended to be financial advice. It does not constitute a recommendation to buy or sell any stock, and does not take account of your objectives, or your financial situation. We aim to bring you long-term focused analysis driven by fundamental data. Note that our analysis may not factor in the latest price-sensitive company announcements or qualitative material. Simply Wall St has no position in any stocks mentioned.
