
 Yahoo Finance
 Capital Investment Trends At Omega Flex (NASDAQ:OFLX) Look Strong
If you're looking for a multi-bagger, there's a few things to keep an eye out for. Typically, we'll want to notice a trend of growing return on capital employed (ROCE) and alongside that, an expanding base of capital employed. This shows us that it's a compounding machine, able to continually reinvest its earnings back into the business and generate higher returns. Ergo, when we looked at the ROCE trends at Omega Flex (NASDAQ:OFLX), we liked what we saw.
Understanding Return On Capital Employed (ROCE)
For those that aren't sure what ROCE is, it measures the amount of pre-tax profits a company can generate from the capital employed in its business. Analysts use this formula to calculate it for Omega Flex:
Return on Capital Employed = Earnings Before Interest and Tax (EBIT) ÷ (Total Assets - Current Liabilities)
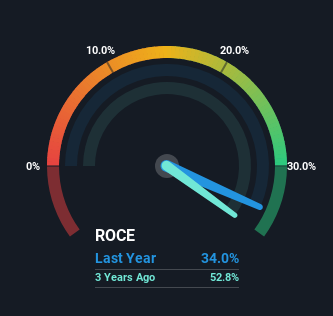
0.34 = US$27m ÷ (US$96m - US$15m) (Based on the trailing twelve months to September 2023).
So, Omega Flex has an ROCE of 34%. In absolute terms that's a great return and it's even better than the Machinery industry average of 12%.
View our latest analysis for Omega Flex
While the past is not representative of the future, it can be helpful to know how a company has performed historically, which is why we have this chart above. If you want to delve into the historical earnings, revenue and cash flow of Omega Flex, check out these free graphs here.
How Are Returns Trending?
Omega Flex deserves to be commended in regards to it's returns. The company has employed 24% more capital in the last five years, and the returns on that capital have remained stable at 34%. Now considering ROCE is an attractive 34%, this combination is actually pretty appealing because it means the business can consistently put money to work and generate these high returns. If Omega Flex can keep this up, we'd be very optimistic about its future.
The Key Takeaway
In summary, we're delighted to see that Omega Flex has been compounding returns by reinvesting at consistently high rates of return, as these are common traits of a multi-bagger. And given the stock has only risen 29% over the last five years, we'd suspect the market is beginning to recognize these trends. So to determine if Omega Flex is a multi-bagger going forward, we'd suggest digging deeper into the company's other fundamentals.
While Omega Flex looks impressive, no company is worth an infinite price. The intrinsic value infographic in our free research report helps visualize whether OFLX is currently trading for a fair price.
If you'd like to see other companies earning high returns, check out our free list of companies earning high returns with solid balance sheets here.
Have feedback on this article? Concerned about the content? Get in touch with us directly. Alternatively, email editorial-team (at) simplywallst.com.
This article by Simply Wall St is general in nature. We provide commentary based on historical data and analyst forecasts only using an unbiased methodology and our articles are not intended to be financial advice. It does not constitute a recommendation to buy or sell any stock, and does not take account of your objectives, or your financial situation. We aim to bring you long-term focused analysis driven by fundamental data. Note that our analysis may not factor in the latest price-sensitive company announcements or qualitative material. Simply Wall St has no position in any stocks mentioned.
