
 Yahoo Finance
 Capital Allocation Trends At Westshore Terminals Investment (TSE:WTE) Aren't Ideal
Did you know there are some financial metrics that can provide clues of a potential multi-bagger? Firstly, we'll want to see a proven return on capital employed (ROCE) that is increasing, and secondly, an expanding base of capital employed. Basically this means that a company has profitable initiatives that it can continue to reinvest in, which is a trait of a compounding machine. Having said that, from a first glance at Westshore Terminals Investment (TSE:WTE) we aren't jumping out of our chairs at how returns are trending, but let's have a deeper look.
Understanding Return On Capital Employed (ROCE)
For those who don't know, ROCE is a measure of a company's yearly pre-tax profit (its return), relative to the capital employed in the business. Analysts use this formula to calculate it for Westshore Terminals Investment:
Return on Capital Employed = Earnings Before Interest and Tax (EBIT) ÷ (Total Assets - Current Liabilities)
0.13 = CA$160m ÷ (CA$1.4b - CA$146m) (Based on the trailing twelve months to December 2023).
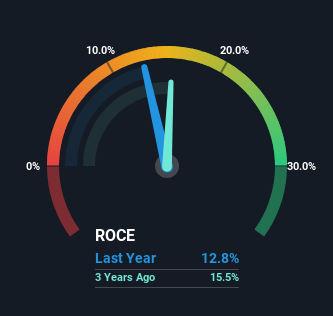
So, Westshore Terminals Investment has an ROCE of 13%. On its own, that's a standard return, however it's much better than the 6.8% generated by the Infrastructure industry.
View our latest analysis for Westshore Terminals Investment
In the above chart we have measured Westshore Terminals Investment's prior ROCE against its prior performance, but the future is arguably more important. If you'd like to see what analysts are forecasting going forward, you should check out our free analyst report for Westshore Terminals Investment .
What Does the ROCE Trend For Westshore Terminals Investment Tell Us?
In terms of Westshore Terminals Investment's historical ROCE movements, the trend isn't fantastic. Over the last five years, returns on capital have decreased to 13% from 17% five years ago. However, given capital employed and revenue have both increased it appears that the business is currently pursuing growth, at the consequence of short term returns. If these investments prove successful, this can bode very well for long term stock performance.
The Bottom Line
While returns have fallen for Westshore Terminals Investment in recent times, we're encouraged to see that sales are growing and that the business is reinvesting in its operations. Furthermore the stock has climbed 61% over the last five years, it would appear that investors are upbeat about the future. So while investors seem to be recognizing these promising trends, we would look further into this stock to make sure the other metrics justify the positive view.
Westshore Terminals Investment does have some risks, we noticed 2 warning signs (and 1 which is a bit unpleasant) we think you should know about.
While Westshore Terminals Investment may not currently earn the highest returns, we've compiled a list of companies that currently earn more than 25% return on equity. Check out this free list here.
Have feedback on this article? Concerned about the content? Get in touch with us directly. Alternatively, email editorial-team (at) simplywallst.com.
This article by Simply Wall St is general in nature. We provide commentary based on historical data and analyst forecasts only using an unbiased methodology and our articles are not intended to be financial advice. It does not constitute a recommendation to buy or sell any stock, and does not take account of your objectives, or your financial situation. We aim to bring you long-term focused analysis driven by fundamental data. Note that our analysis may not factor in the latest price-sensitive company announcements or qualitative material. Simply Wall St has no position in any stocks mentioned.
