
 Yahoo Finance
 Capital Allocation Trends At Vail Resorts (NYSE:MTN) Aren't Ideal
Finding a business that has the potential to grow substantially is not easy, but it is possible if we look at a few key financial metrics. Amongst other things, we'll want to see two things; firstly, a growing return on capital employed (ROCE) and secondly, an expansion in the company's amount of capital employed. Basically this means that a company has profitable initiatives that it can continue to reinvest in, which is a trait of a compounding machine. Although, when we looked at Vail Resorts (NYSE:MTN), it didn't seem to tick all of these boxes.
What is Return On Capital Employed (ROCE)?
For those that aren't sure what ROCE is, it measures the amount of pre-tax profits a company can generate from the capital employed in its business. To calculate this metric for Vail Resorts, this is the formula:
Return on Capital Employed = Earnings Before Interest and Tax (EBIT) ÷ (Total Assets - Current Liabilities)
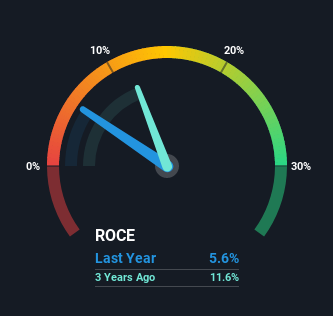
0.056 = US$284m ÷ (US$6.3b - US$1.3b) (Based on the trailing twelve months to October 2021).
Therefore, Vail Resorts has an ROCE of 5.6%. In absolute terms, that's a low return and it also under-performs the Hospitality industry average of 9.0%.
See our latest analysis for Vail Resorts
In the above chart we have measured Vail Resorts' prior ROCE against its prior performance, but the future is arguably more important. If you're interested, you can view the analysts predictions in our free report on analyst forecasts for the company.
So How Is Vail Resorts' ROCE Trending?
On the surface, the trend of ROCE at Vail Resorts doesn't inspire confidence. Over the last five years, returns on capital have decreased to 5.6% from 8.6% five years ago. On the other hand, the company has been employing more capital without a corresponding improvement in sales in the last year, which could suggest these investments are longer term plays. It's worth keeping an eye on the company's earnings from here on to see if these investments do end up contributing to the bottom line.
In Conclusion...
To conclude, we've found that Vail Resorts is reinvesting in the business, but returns have been falling. Although the market must be expecting these trends to improve because the stock has gained 80% over the last five years. However, unless these underlying trends turn more positive, we wouldn't get our hopes up too high.
Vail Resorts does come with some risks though, we found 3 warning signs in our investment analysis, and 1 of those doesn't sit too well with us...
While Vail Resorts isn't earning the highest return, check out this free list of companies that are earning high returns on equity with solid balance sheets.
Have feedback on this article? Concerned about the content? Get in touch with us directly. Alternatively, email editorial-team (at) simplywallst.com.
This article by Simply Wall St is general in nature. We provide commentary based on historical data and analyst forecasts only using an unbiased methodology and our articles are not intended to be financial advice. It does not constitute a recommendation to buy or sell any stock, and does not take account of your objectives, or your financial situation. We aim to bring you long-term focused analysis driven by fundamental data. Note that our analysis may not factor in the latest price-sensitive company announcements or qualitative material. Simply Wall St has no position in any stocks mentioned.
