
 Yahoo Finance
 Capital Allocation Trends At Studio City International Holdings (NYSE:MSC) Aren't Ideal
What are the early trends we should look for to identify a stock that could multiply in value over the long term? Firstly, we'd want to identify a growing return on capital employed (ROCE) and then alongside that, an ever-increasing base of capital employed. Put simply, these types of businesses are compounding machines, meaning they are continually reinvesting their earnings at ever-higher rates of return. In light of that, when we looked at Studio City International Holdings (NYSE:MSC) and its ROCE trend, we weren't exactly thrilled.
Understanding Return On Capital Employed (ROCE)
Just to clarify if you're unsure, ROCE is a metric for evaluating how much pre-tax income (in percentage terms) a company earns on the capital invested in its business. To calculate this metric for Studio City International Holdings, this is the formula:
Return on Capital Employed = Earnings Before Interest and Tax (EBIT) ÷ (Total Assets - Current Liabilities)
0.005 = US$15m ÷ (US$3.2b - US$116m) (Based on the trailing twelve months to March 2024).
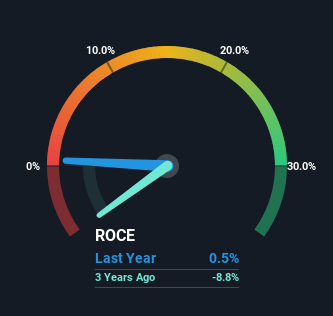
Therefore, Studio City International Holdings has an ROCE of 0.5%. Ultimately, that's a low return and it under-performs the Hospitality industry average of 9.5%.
Check out our latest analysis for Studio City International Holdings
While the past is not representative of the future, it can be helpful to know how a company has performed historically, which is why we have this chart above. If you'd like to look at how Studio City International Holdings has performed in the past in other metrics, you can view this free graph of Studio City International Holdings' past earnings, revenue and cash flow.
What Can We Tell From Studio City International Holdings' ROCE Trend?
On the surface, the trend of ROCE at Studio City International Holdings doesn't inspire confidence. Over the last five years, returns on capital have decreased to 0.5% from 5.1% five years ago. However, given capital employed and revenue have both increased it appears that the business is currently pursuing growth, at the consequence of short term returns. If these investments prove successful, this can bode very well for long term stock performance.
On a related note, Studio City International Holdings has decreased its current liabilities to 3.6% of total assets. That could partly explain why the ROCE has dropped. What's more, this can reduce some aspects of risk to the business because now the company's suppliers or short-term creditors are funding less of its operations. Since the business is basically funding more of its operations with it's own money, you could argue this has made the business less efficient at generating ROCE.
What We Can Learn From Studio City International Holdings' ROCE
In summary, despite lower returns in the short term, we're encouraged to see that Studio City International Holdings is reinvesting for growth and has higher sales as a result. And there could be an opportunity here if other metrics look good too, because the stock has declined 60% in the last five years. So we think it'd be worthwhile to look further into this stock given the trends look encouraging.
On a final note, we found 3 warning signs for Studio City International Holdings (2 are significant) you should be aware of.
If you want to search for solid companies with great earnings, check out this free list of companies with good balance sheets and impressive returns on equity.
Have feedback on this article? Concerned about the content? Get in touch with us directly. Alternatively, email editorial-team (at) simplywallst.com.
This article by Simply Wall St is general in nature. We provide commentary based on historical data and analyst forecasts only using an unbiased methodology and our articles are not intended to be financial advice. It does not constitute a recommendation to buy or sell any stock, and does not take account of your objectives, or your financial situation. We aim to bring you long-term focused analysis driven by fundamental data. Note that our analysis may not factor in the latest price-sensitive company announcements or qualitative material. Simply Wall St has no position in any stocks mentioned.
