
 Yahoo Finance
 Capital Allocation Trends At SATS (SGX:S58) Aren't Ideal
What trends should we look for it we want to identify stocks that can multiply in value over the long term? In a perfect world, we'd like to see a company investing more capital into its business and ideally the returns earned from that capital are also increasing. Ultimately, this demonstrates that it's a business that is reinvesting profits at increasing rates of return. Although, when we looked at SATS (SGX:S58), it didn't seem to tick all of these boxes.
What Is Return On Capital Employed (ROCE)?
For those who don't know, ROCE is a measure of a company's yearly pre-tax profit (its return), relative to the capital employed in the business. The formula for this calculation on SATS is:
Return on Capital Employed = Earnings Before Interest and Tax (EBIT) ÷ (Total Assets - Current Liabilities)
0.01 = S$70m ÷ (S$8.5b - S$1.7b) (Based on the trailing twelve months to September 2023).
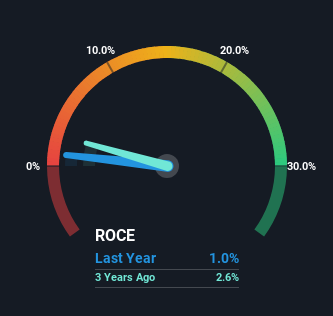
Therefore, SATS has an ROCE of 1.0%. Ultimately, that's a low return and it under-performs the Infrastructure industry average of 6.4%.
Check out our latest analysis for SATS
In the above chart we have measured SATS' prior ROCE against its prior performance, but the future is arguably more important. If you'd like to see what analysts are forecasting going forward, you should check out our free report for SATS.
What The Trend Of ROCE Can Tell Us
In terms of SATS' historical ROCE movements, the trend isn't fantastic. Over the last five years, returns on capital have decreased to 1.0% from 12% five years ago. However, given capital employed and revenue have both increased it appears that the business is currently pursuing growth, at the consequence of short term returns. If these investments prove successful, this can bode very well for long term stock performance.
The Bottom Line
While returns have fallen for SATS in recent times, we're encouraged to see that sales are growing and that the business is reinvesting in its operations. However, despite the promising trends, the stock has fallen 35% over the last five years, so there might be an opportunity here for astute investors. As a result, we'd recommend researching this stock further to uncover what other fundamentals of the business can show us.
If you want to know some of the risks facing SATS we've found 2 warning signs (1 is a bit concerning!) that you should be aware of before investing here.
While SATS isn't earning the highest return, check out this free list of companies that are earning high returns on equity with solid balance sheets.
Have feedback on this article? Concerned about the content? Get in touch with us directly. Alternatively, email editorial-team (at) simplywallst.com.
This article by Simply Wall St is general in nature. We provide commentary based on historical data and analyst forecasts only using an unbiased methodology and our articles are not intended to be financial advice. It does not constitute a recommendation to buy or sell any stock, and does not take account of your objectives, or your financial situation. We aim to bring you long-term focused analysis driven by fundamental data. Note that our analysis may not factor in the latest price-sensitive company announcements or qualitative material. Simply Wall St has no position in any stocks mentioned.
