
 Yahoo Finance
 Capital Allocation Trends At Molina Healthcare (NYSE:MOH) Aren't Ideal
Finding a business that has the potential to grow substantially is not easy, but it is possible if we look at a few key financial metrics. In a perfect world, we'd like to see a company investing more capital into its business and ideally the returns earned from that capital are also increasing. Ultimately, this demonstrates that it's a business that is reinvesting profits at increasing rates of return. So when we looked at Molina Healthcare (NYSE:MOH), they do have a high ROCE, but we weren't exactly elated from how returns are trending.
What Is Return On Capital Employed (ROCE)?
If you haven't worked with ROCE before, it measures the 'return' (pre-tax profit) a company generates from capital employed in its business. The formula for this calculation on Molina Healthcare is:
Return on Capital Employed = Earnings Before Interest and Tax (EBIT) ÷ (Total Assets - Current Liabilities)
0.23 = US$1.6b ÷ (US$16b - US$8.5b) (Based on the trailing twelve months to March 2024).
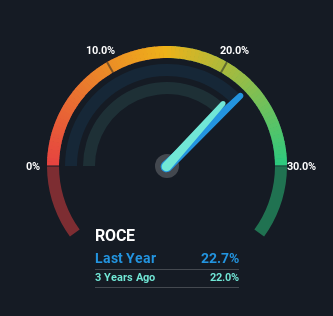
Thus, Molina Healthcare has an ROCE of 23%. In absolute terms that's a great return and it's even better than the Healthcare industry average of 11%.
Check out our latest analysis for Molina Healthcare
In the above chart we have measured Molina Healthcare's prior ROCE against its prior performance, but the future is arguably more important. If you'd like, you can check out the forecasts from the analysts covering Molina Healthcare for free.
What Can We Tell From Molina Healthcare's ROCE Trend?
When we looked at the ROCE trend at Molina Healthcare, we didn't gain much confidence. Historically returns on capital were even higher at 37%, but they have dropped over the last five years. Meanwhile, the business is utilizing more capital but this hasn't moved the needle much in terms of sales in the past 12 months, so this could reflect longer term investments. It may take some time before the company starts to see any change in earnings from these investments.
On a separate but related note, it's important to know that Molina Healthcare has a current liabilities to total assets ratio of 55%, which we'd consider pretty high. This can bring about some risks because the company is basically operating with a rather large reliance on its suppliers or other sorts of short-term creditors. Ideally we'd like to see this reduce as that would mean fewer obligations bearing risks.
What We Can Learn From Molina Healthcare's ROCE
In summary, Molina Healthcare is reinvesting funds back into the business for growth but unfortunately it looks like sales haven't increased much just yet. Investors must think there's better things to come because the stock has knocked it out of the park, delivering a 160% gain to shareholders who have held over the last five years. However, unless these underlying trends turn more positive, we wouldn't get our hopes up too high.
Molina Healthcare could be trading at an attractive price in other respects, so you might find our free intrinsic value estimation for MOH on our platform quite valuable.
High returns are a key ingredient to strong performance, so check out our free list ofstocks earning high returns on equity with solid balance sheets.
Have feedback on this article? Concerned about the content? Get in touch with us directly. Alternatively, email editorial-team (at) simplywallst.com.
This article by Simply Wall St is general in nature. We provide commentary based on historical data and analyst forecasts only using an unbiased methodology and our articles are not intended to be financial advice. It does not constitute a recommendation to buy or sell any stock, and does not take account of your objectives, or your financial situation. We aim to bring you long-term focused analysis driven by fundamental data. Note that our analysis may not factor in the latest price-sensitive company announcements or qualitative material. Simply Wall St has no position in any stocks mentioned.
