
 Yahoo Finance
 Capital Allocation Trends At Hamilton Thorne (CVE:HTL) Aren't Ideal
If we want to find a potential multi-bagger, often there are underlying trends that can provide clues. Firstly, we'll want to see a proven return on capital employed (ROCE) that is increasing, and secondly, an expanding base of capital employed. Ultimately, this demonstrates that it's a business that is reinvesting profits at increasing rates of return. However, after briefly looking over the numbers, we don't think Hamilton Thorne (CVE:HTL) has the makings of a multi-bagger going forward, but let's have a look at why that may be.
Understanding Return On Capital Employed (ROCE)
For those that aren't sure what ROCE is, it measures the amount of pre-tax profits a company can generate from the capital employed in its business. Analysts use this formula to calculate it for Hamilton Thorne:
Return on Capital Employed = Earnings Before Interest and Tax (EBIT) ÷ (Total Assets - Current Liabilities)
0.08 = US$4.7m ÷ (US$70m - US$11m) (Based on the trailing twelve months to June 2021).
Thus, Hamilton Thorne has an ROCE of 8.0%. On its own, that's a low figure but it's around the 8.6% average generated by the Medical Equipment industry.
See our latest analysis for Hamilton Thorne
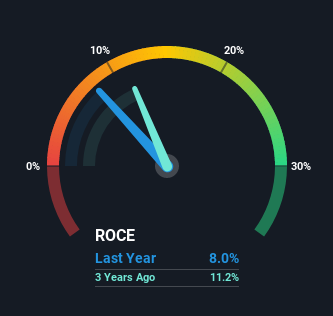
Above you can see how the current ROCE for Hamilton Thorne compares to its prior returns on capital, but there's only so much you can tell from the past. If you're interested, you can view the analysts predictions in our free report on analyst forecasts for the company.
What The Trend Of ROCE Can Tell Us
When we looked at the ROCE trend at Hamilton Thorne, we didn't gain much confidence. To be more specific, ROCE has fallen from 18% over the last five years. Although, given both revenue and the amount of assets employed in the business have increased, it could suggest the company is investing in growth, and the extra capital has led to a short-term reduction in ROCE. If these investments prove successful, this can bode very well for long term stock performance.
On a related note, Hamilton Thorne has decreased its current liabilities to 16% of total assets. That could partly explain why the ROCE has dropped. Effectively this means their suppliers or short-term creditors are funding less of the business, which reduces some elements of risk. Since the business is basically funding more of its operations with it's own money, you could argue this has made the business less efficient at generating ROCE.
In Conclusion...
In summary, despite lower returns in the short term, we're encouraged to see that Hamilton Thorne is reinvesting for growth and has higher sales as a result. And long term investors must be optimistic going forward because the stock has returned a huge 543% to shareholders in the last five years. So while the underlying trends could already be accounted for by investors, we still think this stock is worth looking into further.
Like most companies, Hamilton Thorne does come with some risks, and we've found 1 warning sign that you should be aware of.
While Hamilton Thorne isn't earning the highest return, check out this free list of companies that are earning high returns on equity with solid balance sheets.
This article by Simply Wall St is general in nature. We provide commentary based on historical data and analyst forecasts only using an unbiased methodology and our articles are not intended to be financial advice. It does not constitute a recommendation to buy or sell any stock, and does not take account of your objectives, or your financial situation. We aim to bring you long-term focused analysis driven by fundamental data. Note that our analysis may not factor in the latest price-sensitive company announcements or qualitative material. Simply Wall St has no position in any stocks mentioned.
Have feedback on this article? Concerned about the content? Get in touch with us directly. Alternatively, email editorial-team (at) simplywallst.com.
