
 Yahoo Finance
 Capital Allocation Trends At Clearwater Analytics Holdings (NYSE:CWAN) Aren't Ideal
To find a multi-bagger stock, what are the underlying trends we should look for in a business? Ideally, a business will show two trends; firstly a growing return on capital employed (ROCE) and secondly, an increasing amount of capital employed. Ultimately, this demonstrates that it's a business that is reinvesting profits at increasing rates of return. Although, when we looked at Clearwater Analytics Holdings (NYSE:CWAN), it didn't seem to tick all of these boxes.
Understanding Return On Capital Employed (ROCE)
For those that aren't sure what ROCE is, it measures the amount of pre-tax profits a company can generate from the capital employed in its business. Analysts use this formula to calculate it for Clearwater Analytics Holdings:
Return on Capital Employed = Earnings Before Interest and Tax (EBIT) ÷ (Total Assets - Current Liabilities)
0.0098 = US$4.7m ÷ (US$548m - US$71m) (Based on the trailing twelve months to March 2024).
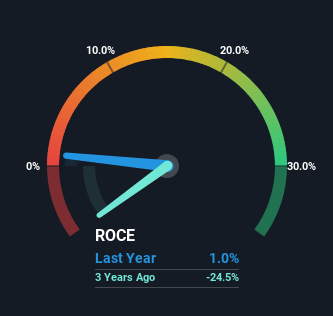
Therefore, Clearwater Analytics Holdings has an ROCE of 1.0%. In absolute terms, that's a low return and it also under-performs the Software industry average of 7.4%.
See our latest analysis for Clearwater Analytics Holdings
Above you can see how the current ROCE for Clearwater Analytics Holdings compares to its prior returns on capital, but there's only so much you can tell from the past. If you're interested, you can view the analysts predictions in our free analyst report for Clearwater Analytics Holdings .
How Are Returns Trending?
We weren't thrilled with the trend because Clearwater Analytics Holdings' ROCE has reduced by 96% over the last four years, while the business employed 820% more capital. That being said, Clearwater Analytics Holdings raised some capital prior to their latest results being released, so that could partly explain the increase in capital employed. It's unlikely that all of the funds raised have been put to work yet, so as a consequence Clearwater Analytics Holdings might not have received a full period of earnings contribution from it.
On a side note, Clearwater Analytics Holdings has done well to pay down its current liabilities to 13% of total assets. So we could link some of this to the decrease in ROCE. What's more, this can reduce some aspects of risk to the business because now the company's suppliers or short-term creditors are funding less of its operations. Since the business is basically funding more of its operations with it's own money, you could argue this has made the business less efficient at generating ROCE.
The Key Takeaway
While returns have fallen for Clearwater Analytics Holdings in recent times, we're encouraged to see that sales are growing and that the business is reinvesting in its operations. And the stock has followed suit returning a meaningful 18% to shareholders over the last year. So while investors seem to be recognizing these promising trends, we would look further into this stock to make sure the other metrics justify the positive view.
One more thing, we've spotted 1 warning sign facing Clearwater Analytics Holdings that you might find interesting.
For those who like to invest in solid companies, check out this free list of companies with solid balance sheets and high returns on equity.
Have feedback on this article? Concerned about the content? Get in touch with us directly. Alternatively, email editorial-team (at) simplywallst.com.
This article by Simply Wall St is general in nature. We provide commentary based on historical data and analyst forecasts only using an unbiased methodology and our articles are not intended to be financial advice. It does not constitute a recommendation to buy or sell any stock, and does not take account of your objectives, or your financial situation. We aim to bring you long-term focused analysis driven by fundamental data. Note that our analysis may not factor in the latest price-sensitive company announcements or qualitative material. Simply Wall St has no position in any stocks mentioned.
