
 Yahoo Finance
 Capital Allocation Trends At Canlan Ice Sports (TSE:ICE) Aren't Ideal
Ignoring the stock price of a company, what are the underlying trends that tell us a business is past the growth phase? A business that's potentially in decline often shows two trends, a return on capital employed (ROCE) that's declining, and a base of capital employed that's also declining. Trends like this ultimately mean the business is reducing its investments and also earning less on what it has invested. And from a first read, things don't look too good at Canlan Ice Sports (TSE:ICE), so let's see why.
Return On Capital Employed (ROCE): What Is It?
If you haven't worked with ROCE before, it measures the 'return' (pre-tax profit) a company generates from capital employed in its business. The formula for this calculation on Canlan Ice Sports is:
Return on Capital Employed = Earnings Before Interest and Tax (EBIT) ÷ (Total Assets - Current Liabilities)
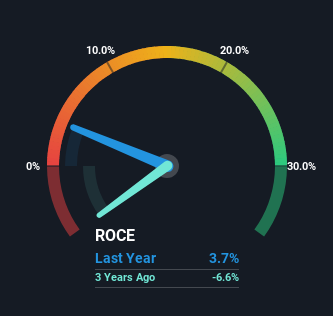
0.037 = CA$3.4m ÷ (CA$119m - CA$27m) (Based on the trailing twelve months to September 2023).
Thus, Canlan Ice Sports has an ROCE of 3.7%. Ultimately, that's a low return and it under-performs the Hospitality industry average of 11%.
Check out our latest analysis for Canlan Ice Sports
While the past is not representative of the future, it can be helpful to know how a company has performed historically, which is why we have this chart above. If you're interested in investigating Canlan Ice Sports' past further, check out this free graph covering Canlan Ice Sports' past earnings, revenue and cash flow.
What Can We Tell From Canlan Ice Sports' ROCE Trend?
There is reason to be cautious about Canlan Ice Sports, given the returns are trending downwards. About five years ago, returns on capital were 8.0%, however they're now substantially lower than that as we saw above. Meanwhile, capital employed in the business has stayed roughly the flat over the period. Since returns are falling and the business has the same amount of assets employed, this can suggest it's a mature business that hasn't had much growth in the last five years. So because these trends aren't typically conducive to creating a multi-bagger, we wouldn't hold our breath on Canlan Ice Sports becoming one if things continue as they have.
In Conclusion...
In the end, the trend of lower returns on the same amount of capital isn't typically an indication that we're looking at a growth stock. And long term shareholders have watched their investments stay flat over the last five years. Unless there is a shift to a more positive trajectory in these metrics, we would look elsewhere.
If you'd like to know more about Canlan Ice Sports, we've spotted 6 warning signs, and 1 of them is a bit concerning.
While Canlan Ice Sports isn't earning the highest return, check out this free list of companies that are earning high returns on equity with solid balance sheets.
Have feedback on this article? Concerned about the content? Get in touch with us directly. Alternatively, email editorial-team (at) simplywallst.com.
This article by Simply Wall St is general in nature. We provide commentary based on historical data and analyst forecasts only using an unbiased methodology and our articles are not intended to be financial advice. It does not constitute a recommendation to buy or sell any stock, and does not take account of your objectives, or your financial situation. We aim to bring you long-term focused analysis driven by fundamental data. Note that our analysis may not factor in the latest price-sensitive company announcements or qualitative material. Simply Wall St has no position in any stocks mentioned.
