
 Yahoo Finance
 Capital Allocation Trends At Broadridge Financial Solutions (NYSE:BR) Aren't Ideal
Did you know there are some financial metrics that can provide clues of a potential multi-bagger? Ideally, a business will show two trends; firstly a growing return on capital employed (ROCE) and secondly, an increasing amount of capital employed. Basically this means that a company has profitable initiatives that it can continue to reinvest in, which is a trait of a compounding machine. However, after briefly looking over the numbers, we don't think Broadridge Financial Solutions (NYSE:BR) has the makings of a multi-bagger going forward, but let's have a look at why that may be.
What Is Return On Capital Employed (ROCE)?
For those that aren't sure what ROCE is, it measures the amount of pre-tax profits a company can generate from the capital employed in its business. Analysts use this formula to calculate it for Broadridge Financial Solutions:
Return on Capital Employed = Earnings Before Interest and Tax (EBIT) ÷ (Total Assets - Current Liabilities)
0.15 = US$1.0b ÷ (US$8.2b - US$1.1b) (Based on the trailing twelve months to March 2024).
Therefore, Broadridge Financial Solutions has an ROCE of 15%. That's a relatively normal return on capital, and it's around the 14% generated by the Professional Services industry.
View our latest analysis for Broadridge Financial Solutions
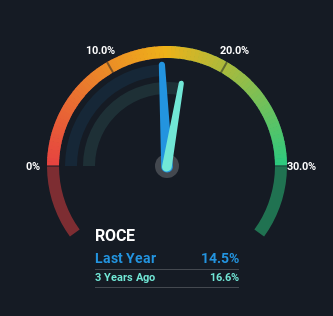
Above you can see how the current ROCE for Broadridge Financial Solutions compares to its prior returns on capital, but there's only so much you can tell from the past. If you'd like to see what analysts are forecasting going forward, you should check out our free analyst report for Broadridge Financial Solutions .
How Are Returns Trending?
In terms of Broadridge Financial Solutions' historical ROCE movements, the trend isn't fantastic. Around five years ago the returns on capital were 23%, but since then they've fallen to 15%. Meanwhile, the business is utilizing more capital but this hasn't moved the needle much in terms of sales in the past 12 months, so this could reflect longer term investments. It may take some time before the company starts to see any change in earnings from these investments.
What We Can Learn From Broadridge Financial Solutions' ROCE
In summary, Broadridge Financial Solutions is reinvesting funds back into the business for growth but unfortunately it looks like sales haven't increased much just yet. Although the market must be expecting these trends to improve because the stock has gained 67% over the last five years. But if the trajectory of these underlying trends continue, we think the likelihood of it being a multi-bagger from here isn't high.
Broadridge Financial Solutions does have some risks though, and we've spotted 2 warning signs for Broadridge Financial Solutions that you might be interested in.
For those who like to invest in solid companies, check out this free list of companies with solid balance sheets and high returns on equity.
Have feedback on this article? Concerned about the content? Get in touch with us directly. Alternatively, email editorial-team (at) simplywallst.com.
This article by Simply Wall St is general in nature. We provide commentary based on historical data and analyst forecasts only using an unbiased methodology and our articles are not intended to be financial advice. It does not constitute a recommendation to buy or sell any stock, and does not take account of your objectives, or your financial situation. We aim to bring you long-term focused analysis driven by fundamental data. Note that our analysis may not factor in the latest price-sensitive company announcements or qualitative material. Simply Wall St has no position in any stocks mentioned.
