
 Yahoo Finance
 Should Campbell Soup Company (NYSE:CPB) Be Part Of Your Dividend Portfolio?

Today we'll take a closer look at Campbell Soup Company (NYSE:CPB) from a dividend investor's perspective. Owning a strong business and reinvesting the dividends is widely seen as an attractive way of growing your wealth. Yet sometimes, investors buy a popular dividend stock because of its yield, and then lose money if the company's dividend doesn't live up to expectations.
A high yield and a long history of paying dividends is an appealing combination for Campbell Soup. We'd guess that plenty of investors have purchased it for the income. When buying stocks for their dividends, you should always run through the checks below, to see if the dividend looks sustainable.
Click the interactive chart for our full dividend analysis
Want to participate in a short research study? Help shape the future of investing tools and you could win a $250 gift card!
Payout ratios
Dividends are typically paid from company earnings. If a company pays more in dividends than it earned, then the dividend might become unsustainable - hardly an ideal situation. Comparing dividend payments to a company's net profit after tax is a simple way of reality-checking whether a dividend is sustainable. While Campbell Soup pays a dividend, it reported a loss over the last year. When a company recently reported a loss, we should investigate if its cash flows covered the dividend.
As a loss-making company, we can also measure Campbell Soup's dividend payments against its levered free cash flow, to see if enough cash was generated to cover the dividend. Of the free cash flow it generated last year, Campbell Soup paid out 42% as dividends, suggesting the dividend is affordable.
Is Campbell Soup's Balance Sheet Risky?
Given Campbell Soup is paying a dividend but reported a loss over the past year, we need to check its balance sheet for signs of financial distress. A rough way to check this is with these two simple ratios: a) net debt divided by EBITDA (earnings before interest, tax, depreciation and amortisation), and b) net interest cover. Net debt to EBITDA measures a company's total debt load relative to its earnings (lower = less debt), while net interest cover measures the company's ability to pay the interest on its debt (higher = greater ability to pay interest costs). Campbell Soup has net debt of more than 3x its EBITDA, which is getting towards the limit of most investors' comfort zones. Judicious use of debt can enhance shareholder returns, but also adds to the risk if something goes awry.
We calculated its interest cover by measuring its earnings before interest and tax (EBIT), and dividing this by the company's net interest expense. With EBIT of 4.77 times its interest expense, Campbell Soup's interest cover is starting to look a bit thin.
Consider getting our latest analysis on Campbell Soup's financial position here.
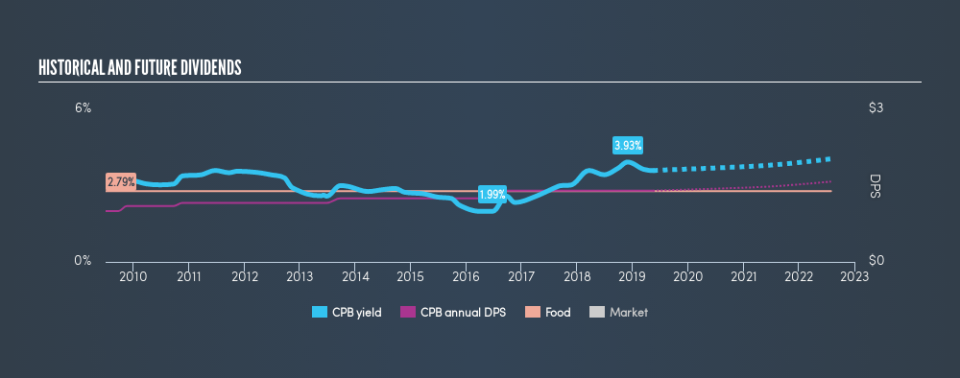
Dividend Volatility
One of the major risks of relying on dividend income, is the potential for a company to struggle financially and cut its dividend. Not only is your income cut, but the value of your investment declines as well - nasty. Campbell Soup has been paying dividends for a long time, but for the purpose of this analysis, we only examine the past 10 years of payments. During this period the dividend has been stable, which could imply the business could have relatively consistent earnings power. During the past ten-year period, the first annual payment was US$1.00 in 2009, compared to US$1.40 last year. Dividends per share have grown at approximately 3.4% per year over this time.
Dividend Growth Potential
While dividend payments have been relatively reliable, it would also be nice if earnings per share (EPS) were growing, as this is essential to maintaining the dividend's purchasing power over the long term. Over the past five years, it looks as though Campbell Soup's EPS have declined at around 14% a year. Declining earnings per share over a number of years is not a great sign for the dividend investor. Without some improvement, this does not bode well for the long term value of a company's dividend.
Conclusion
To summarise, shareholders should always check that Campbell Soup's dividends are affordable, that its dividend payments are relatively stable, and that it has decent prospects for growing its earnings and dividend. We're not keen on the fact that Campbell Soup paid out such a high percentage of its income, although its cashflow is in better shape. Second, earnings per share have actually shrunk, but at least the dividends have been relatively stable. Ultimately, Campbell Soup comes up short on our dividend analysis. It's not that we think it is a bad company - just that there are likely more appealing dividend prospects out there on this analysis.
Given that earnings are not growing, the dividend does not look nearly so attractive. See if the 13 analysts are forecasting a turnaround in our free collection of analyst estimates here.
We have also put together a list of global stocks with a market capitalisation above $1bn and yielding more 3%.
We aim to bring you long-term focused research analysis driven by fundamental data. Note that our analysis may not factor in the latest price-sensitive company announcements or qualitative material.
If you spot an error that warrants correction, please contact the editor at editorial-team@simplywallst.com. This article by Simply Wall St is general in nature. It does not constitute a recommendation to buy or sell any stock, and does not take account of your objectives, or your financial situation. Simply Wall St has no position in the stocks mentioned. Thank you for reading.
