
 Yahoo Finance
 Will Calfrac Well Services Ltd (TSE:CFW) Continue To Underperform Its Industry?

The content of this article will benefit those of you who are starting to educate yourself about investing in the stock market and want a simplistic look at the return on Calfrac Well Services Ltd (TSE:CFW) stock.
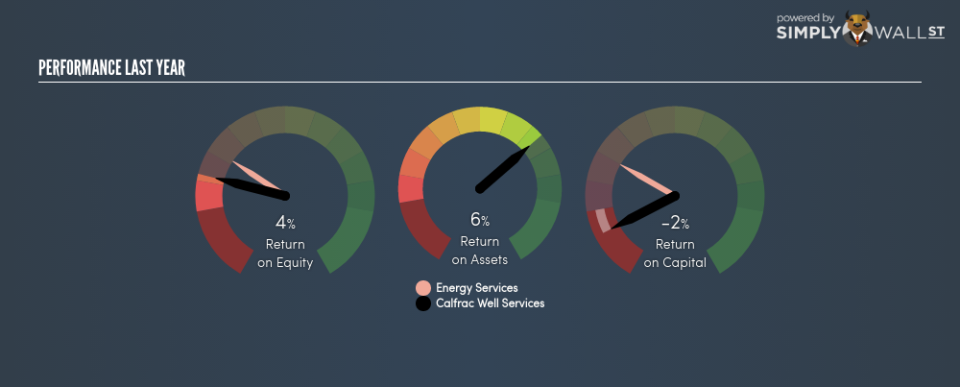
Calfrac Well Services Ltd (TSE:CFW) generated a below-average return on equity of 3.90% in the past 12 months, while its industry returned 6.97%. An investor may attribute an inferior ROE to a relatively inefficient performance, and whilst this can often be the case, knowing the nuts and bolts of the ROE calculation may change that perspective and give you a deeper insight into CFW’s past performance. Today I will look at how components such as financial leverage can influence ROE which may impact the sustainability of CFW’s returns. Check out our latest analysis for Calfrac Well Services
Breaking down ROE — the mother of all ratios
Return on Equity (ROE) is a measure of Calfrac Well Services’s profit relative to its shareholders’ equity. An ROE of 3.90% implies CA$0.039 returned on every CA$1 invested. In most cases, a higher ROE is preferred; however, there are many other factors we must consider prior to making any investment decisions.
Return on Equity = Net Profit ÷ Shareholders Equity
ROE is measured against cost of equity in order to determine the efficiency of Calfrac Well Services’s equity capital deployed. Its cost of equity is 17.66%. This means Calfrac Well Services’s returns actually do not cover its own cost of equity, with a discrepancy of -13.76%. This isn’t sustainable as it implies, very simply, that the company pays more for its capital than what it generates in return. ROE can be split up into three useful ratios: net profit margin, asset turnover, and financial leverage. This is called the Dupont Formula:
Dupont Formula
ROE = profit margin × asset turnover × financial leverage
ROE = (annual net profit ÷ sales) × (sales ÷ assets) × (assets ÷ shareholders’ equity)
ROE = annual net profit ÷ shareholders’ equity
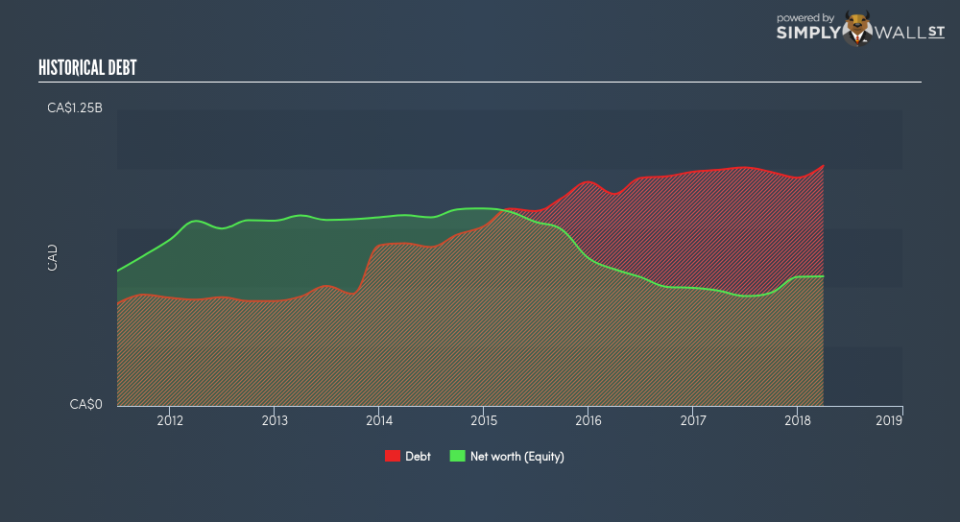
Essentially, profit margin shows how much money the company makes after paying for all its expenses. Asset turnover reveals how much revenue can be generated from Calfrac Well Services’s asset base. Finally, financial leverage will be our main focus today. It shows how much of assets are funded by equity and can show how sustainable the company’s capital structure is. Since ROE can be inflated by excessive debt, we need to examine Calfrac Well Services’s debt-to-equity level. At 185.52%, Calfrac Well Services’s debt-to-equity ratio appears relatively high and indicates the below-average ROE is already being generated by significant leverage levels.
Next Steps:
ROE is a simple yet informative ratio, illustrating the various components that each measure the quality of the overall stock. Calfrac Well Services’s below-industry ROE is disappointing, furthermore, its returns were not even high enough to cover its own cost of equity. Its concerning leverage level means its ROE is already supported by high debt, raising questions over whether ROE will further decline in the future. ROE is a helpful signal, but it is definitely not sufficient on its own to make an investment decision.
For Calfrac Well Services, there are three pertinent factors you should look at:
Financial Health: Does it have a healthy balance sheet? Take a look at our free balance sheet analysis with six simple checks on key factors like leverage and risk.
Valuation: What is Calfrac Well Services worth today? Is the stock undervalued, even when its growth outlook is factored into its intrinsic value? The intrinsic value infographic in our free research report helps visualize whether Calfrac Well Services is currently mispriced by the market.
Other High-Growth Alternatives : Are there other high-growth stocks you could be holding instead of Calfrac Well Services? Explore our interactive list of stocks with large growth potential to get an idea of what else is out there you may be missing!
To help readers see pass the short term volatility of the financial market, we aim to bring you a long-term focused research analysis purely driven by fundamental data. Note that our analysis does not factor in the latest price sensitive company announcements.
The author is an independent contributor and at the time of publication had no position in the stocks mentioned.
