
 Yahoo Finance
 Calculating The Intrinsic Value Of MBH Corporation PLC (FRA:M8H0)
Key Insights
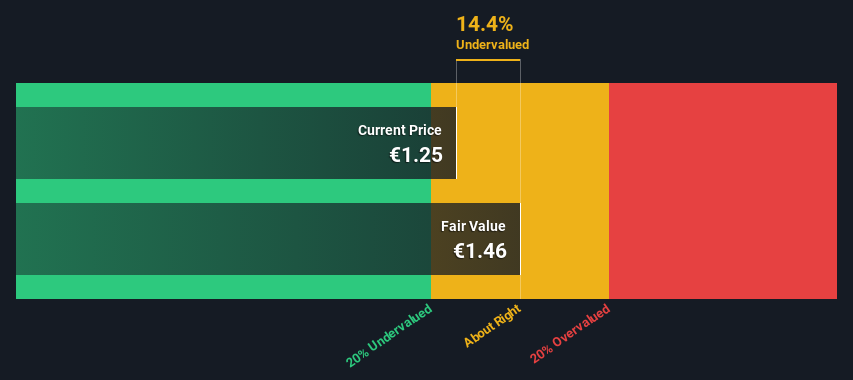
Using the 2 Stage Free Cash Flow to Equity, MBH fair value estimate is €1.46
MBH's €1.25 share price indicates it is trading at similar levels as its fair value estimate
Industry average discount to fair value of 27% suggests MBH's peers are currently trading at a higher discount
How far off is MBH Corporation PLC (FRA:M8H0) from its intrinsic value? Using the most recent financial data, we'll take a look at whether the stock is fairly priced by projecting its future cash flows and then discounting them to today's value. We will use the Discounted Cash Flow (DCF) model on this occasion. Models like these may appear beyond the comprehension of a lay person, but they're fairly easy to follow.
Remember though, that there are many ways to estimate a company's value, and a DCF is just one method. For those who are keen learners of equity analysis, the Simply Wall St analysis model here may be something of interest to you.
View our latest analysis for MBH
The Method
We are going to use a two-stage DCF model, which, as the name states, takes into account two stages of growth. The first stage is generally a higher growth period which levels off heading towards the terminal value, captured in the second 'steady growth' period. To start off with, we need to estimate the next ten years of cash flows. Seeing as no analyst estimates of free cash flow are available to us, we have extrapolate the previous free cash flow (FCF) from the company's last reported value. We assume companies with shrinking free cash flow will slow their rate of shrinkage, and that companies with growing free cash flow will see their growth rate slow, over this period. We do this to reflect that growth tends to slow more in the early years than it does in later years.
Generally we assume that a dollar today is more valuable than a dollar in the future, so we discount the value of these future cash flows to their estimated value in today's dollars:
10-year free cash flow (FCF) estimate
2024 | 2025 | 2026 | 2027 | 2028 | 2029 | 2030 | 2031 | 2032 | 2033 | |
Levered FCF (£, Millions) | UK£903.4k | UK£604.4k | UK£465.0k | UK£390.4k | UK£346.9k | UK£320.3k | UK£303.4k | UK£292.5k | UK£285.5k | UK£281.0k |
Growth Rate Estimate Source | Est @ -47.44% | Est @ -33.10% | Est @ -23.07% | Est @ -16.04% | Est @ -11.12% | Est @ -7.68% | Est @ -5.27% | Est @ -3.59% | Est @ -2.40% | Est @ -1.58% |
Present Value (£, Millions) Discounted @ 12% | UK£0.8 | UK£0.5 | UK£0.3 | UK£0.2 | UK£0.2 | UK£0.2 | UK£0.1 | UK£0.1 | UK£0.1 | UK£0.09 |
("Est" = FCF growth rate estimated by Simply Wall St)
Present Value of 10-year Cash Flow (PVCF) = UK£2.7m
After calculating the present value of future cash flows in the initial 10-year period, we need to calculate the Terminal Value, which accounts for all future cash flows beyond the first stage. The Gordon Growth formula is used to calculate Terminal Value at a future annual growth rate equal to the 5-year average of the 10-year government bond yield of 0.4%. We discount the terminal cash flows to today's value at a cost of equity of 12%.
Terminal Value (TV)= FCF2033 × (1 + g) ÷ (r – g) = UK£281k× (1 + 0.4%) ÷ (12%– 0.4%) = UK£2.4m
Present Value of Terminal Value (PVTV)= TV / (1 + r)10= UK£2.4m÷ ( 1 + 12%)10= UK£757k
The total value is the sum of cash flows for the next ten years plus the discounted terminal value, which results in the Total Equity Value, which in this case is UK£3.4m. To get the intrinsic value per share, we divide this by the total number of shares outstanding. Relative to the current share price of €1.3, the company appears about fair value at a 14% discount to where the stock price trades currently. Valuations are imprecise instruments though, rather like a telescope - move a few degrees and end up in a different galaxy. Do keep this in mind.
The Assumptions
Now the most important inputs to a discounted cash flow are the discount rate, and of course, the actual cash flows. You don't have to agree with these inputs, I recommend redoing the calculations yourself and playing with them. The DCF also does not consider the possible cyclicality of an industry, or a company's future capital requirements, so it does not give a full picture of a company's potential performance. Given that we are looking at MBH as potential shareholders, the cost of equity is used as the discount rate, rather than the cost of capital (or weighted average cost of capital, WACC) which accounts for debt. In this calculation we've used 12%, which is based on a levered beta of 2.000. Beta is a measure of a stock's volatility, compared to the market as a whole. We get our beta from the industry average beta of globally comparable companies, with an imposed limit between 0.8 and 2.0, which is a reasonable range for a stable business.
SWOT Analysis for MBH
Strength
Net debt to equity ratio below 40%.
Dividends are covered by earnings and cash flows.
Weakness
Earnings declined over the past year.
Interest payments on debt are not well covered.
Dividend is low compared to the top 25% of dividend payers in the Construction market.
Opportunity
Current share price is below our estimate of fair value.
Lack of analyst coverage makes it difficult to determine M8H0's earnings prospects.
Threat
Debt is not well covered by operating cash flow.
Next Steps:
Whilst important, the DCF calculation ideally won't be the sole piece of analysis you scrutinize for a company. It's not possible to obtain a foolproof valuation with a DCF model. Instead the best use for a DCF model is to test certain assumptions and theories to see if they would lead to the company being undervalued or overvalued. For instance, if the terminal value growth rate is adjusted slightly, it can dramatically alter the overall result. For MBH, we've put together three pertinent factors you should consider:
Risks: Be aware that MBH is showing 4 warning signs in our investment analysis , and 2 of those make us uncomfortable...
Other High Quality Alternatives: Do you like a good all-rounder? Explore our interactive list of high quality stocks to get an idea of what else is out there you may be missing!
Other Environmentally-Friendly Companies: Concerned about the environment and think consumers will buy eco-friendly products more and more? Browse through our interactive list of companies that are thinking about a greener future to discover some stocks you may not have thought of!
PS. Simply Wall St updates its DCF calculation for every German stock every day, so if you want to find the intrinsic value of any other stock just search here.
Have feedback on this article? Concerned about the content? Get in touch with us directly. Alternatively, email editorial-team (at) simplywallst.com.
This article by Simply Wall St is general in nature. We provide commentary based on historical data and analyst forecasts only using an unbiased methodology and our articles are not intended to be financial advice. It does not constitute a recommendation to buy or sell any stock, and does not take account of your objectives, or your financial situation. We aim to bring you long-term focused analysis driven by fundamental data. Note that our analysis may not factor in the latest price-sensitive company announcements or qualitative material. Simply Wall St has no position in any stocks mentioned.
