
 Yahoo Finance
 Calculating The Intrinsic Value Of Foraco International SA (TSE:FAR)
Key Insights
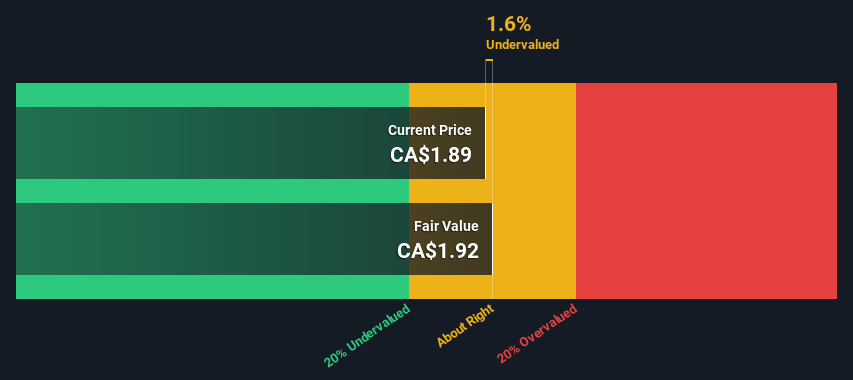
The projected fair value for Foraco International is CA$1.92 based on 2 Stage Free Cash Flow to Equity
Foraco International's CA$1.89 share price indicates it is trading at similar levels as its fair value estimate
Peers of Foraco International are currently trading on average at a 33% premium
Today we'll do a simple run through of a valuation method used to estimate the attractiveness of Foraco International SA (TSE:FAR) as an investment opportunity by taking the expected future cash flows and discounting them to their present value. Our analysis will employ the Discounted Cash Flow (DCF) model. Believe it or not, it's not too difficult to follow, as you'll see from our example!
We would caution that there are many ways of valuing a company and, like the DCF, each technique has advantages and disadvantages in certain scenarios. For those who are keen learners of equity analysis, the Simply Wall St analysis model here may be something of interest to you.
Check out our latest analysis for Foraco International
What's The Estimated Valuation?
We use what is known as a 2-stage model, which simply means we have two different periods of growth rates for the company's cash flows. Generally the first stage is higher growth, and the second stage is a lower growth phase. To begin with, we have to get estimates of the next ten years of cash flows. Seeing as no analyst estimates of free cash flow are available to us, we have extrapolate the previous free cash flow (FCF) from the company's last reported value. We assume companies with shrinking free cash flow will slow their rate of shrinkage, and that companies with growing free cash flow will see their growth rate slow, over this period. We do this to reflect that growth tends to slow more in the early years than it does in later years.
A DCF is all about the idea that a dollar in the future is less valuable than a dollar today, and so the sum of these future cash flows is then discounted to today's value:
10-year free cash flow (FCF) forecast
2023 | 2024 | 2025 | 2026 | 2027 | 2028 | 2029 | 2030 | 2031 | 2032 | |
Levered FCF ($, Millions) | US$15.9m | US$15.7m | US$15.7m | US$15.8m | US$16.0m | US$16.1m | US$16.3m | US$16.6m | US$16.8m | US$17.1m |
Growth Rate Estimate Source | Est @ -1.88% | Est @ -0.79% | Est @ -0.02% | Est @ 0.51% | Est @ 0.89% | Est @ 1.15% | Est @ 1.33% | Est @ 1.46% | Est @ 1.55% | Est @ 1.61% |
Present Value ($, Millions) Discounted @ 12% | US$14.1 | US$12.4 | US$11.1 | US$9.9 | US$8.9 | US$8.0 | US$7.2 | US$6.5 | US$5.9 | US$5.3 |
("Est" = FCF growth rate estimated by Simply Wall St)
Present Value of 10-year Cash Flow (PVCF) = US$89m
The second stage is also known as Terminal Value, this is the business's cash flow after the first stage. The Gordon Growth formula is used to calculate Terminal Value at a future annual growth rate equal to the 5-year average of the 10-year government bond yield of 1.8%. We discount the terminal cash flows to today's value at a cost of equity of 12%.
Terminal Value (TV)= FCF2032 × (1 + g) ÷ (r – g) = US$17m× (1 + 1.8%) ÷ (12%– 1.8%) = US$163m
Present Value of Terminal Value (PVTV)= TV / (1 + r)10= US$163m÷ ( 1 + 12%)10= US$51m
The total value, or equity value, is then the sum of the present value of the future cash flows, which in this case is US$140m. In the final step we divide the equity value by the number of shares outstanding. Relative to the current share price of CA$1.9, the company appears about fair value at a 1.6% discount to where the stock price trades currently. Valuations are imprecise instruments though, rather like a telescope - move a few degrees and end up in a different galaxy. Do keep this in mind.
Important Assumptions
We would point out that the most important inputs to a discounted cash flow are the discount rate and of course the actual cash flows. You don't have to agree with these inputs, I recommend redoing the calculations yourself and playing with them. The DCF also does not consider the possible cyclicality of an industry, or a company's future capital requirements, so it does not give a full picture of a company's potential performance. Given that we are looking at Foraco International as potential shareholders, the cost of equity is used as the discount rate, rather than the cost of capital (or weighted average cost of capital, WACC) which accounts for debt. In this calculation we've used 12%, which is based on a levered beta of 1.571. Beta is a measure of a stock's volatility, compared to the market as a whole. We get our beta from the industry average beta of globally comparable companies, with an imposed limit between 0.8 and 2.0, which is a reasonable range for a stable business.
SWOT Analysis for Foraco International
Strength
Debt is well covered by earnings and cashflows.
Weakness
Earnings declined over the past year.
Opportunity
Current share price is below our estimate of fair value.
Threat
No apparent threats visible for FAR.
Looking Ahead:
Valuation is only one side of the coin in terms of building your investment thesis, and it ideally won't be the sole piece of analysis you scrutinize for a company. DCF models are not the be-all and end-all of investment valuation. Instead the best use for a DCF model is to test certain assumptions and theories to see if they would lead to the company being undervalued or overvalued. If a company grows at a different rate, or if its cost of equity or risk free rate changes sharply, the output can look very different. For Foraco International, there are three pertinent aspects you should consider:
Risks: Consider for instance, the ever-present spectre of investment risk. We've identified 2 warning signs with Foraco International , and understanding them should be part of your investment process.
Future Earnings: How does FAR's growth rate compare to its peers and the wider market? Dig deeper into the analyst consensus number for the upcoming years by interacting with our free analyst growth expectation chart.
Other Solid Businesses: Low debt, high returns on equity and good past performance are fundamental to a strong business. Why not explore our interactive list of stocks with solid business fundamentals to see if there are other companies you may not have considered!
PS. The Simply Wall St app conducts a discounted cash flow valuation for every stock on the TSX every day. If you want to find the calculation for other stocks just search here.
Have feedback on this article? Concerned about the content? Get in touch with us directly. Alternatively, email editorial-team (at) simplywallst.com.
This article by Simply Wall St is general in nature. We provide commentary based on historical data and analyst forecasts only using an unbiased methodology and our articles are not intended to be financial advice. It does not constitute a recommendation to buy or sell any stock, and does not take account of your objectives, or your financial situation. We aim to bring you long-term focused analysis driven by fundamental data. Note that our analysis may not factor in the latest price-sensitive company announcements or qualitative material. Simply Wall St has no position in any stocks mentioned.
Join A Paid User Research Session
You’ll receive a US$30 Amazon Gift card for 1 hour of your time while helping us build better investing tools for the individual investors like yourself. Sign up here
