
 Yahoo Finance
 Calculating The Intrinsic Value Of American Electric Power Company, Inc. (NASDAQ:AEP)
Key Insights
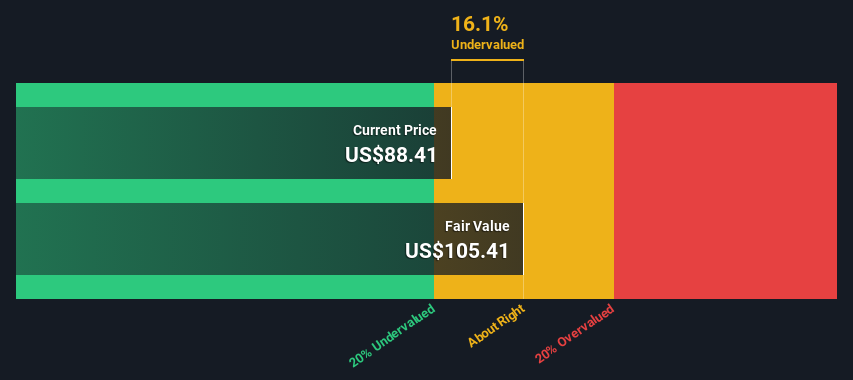
Using the Dividend Discount Model, American Electric Power Company fair value estimate is US$105
American Electric Power Company's US$88.41 share price indicates it is trading at similar levels as its fair value estimate
Analyst price target for AEP is US$90.22 which is 14% below our fair value estimate
Today we will run through one way of estimating the intrinsic value of American Electric Power Company, Inc. (NASDAQ:AEP) by taking the expected future cash flows and discounting them to their present value. This will be done using the Discounted Cash Flow (DCF) model. Models like these may appear beyond the comprehension of a lay person, but they're fairly easy to follow.
Remember though, that there are many ways to estimate a company's value, and a DCF is just one method. If you still have some burning questions about this type of valuation, take a look at the Simply Wall St analysis model.
See our latest analysis for American Electric Power Company
Step By Step Through The Calculation
We have to calculate the value of American Electric Power Company slightly differently to other stocks because it is a electric utilities company. Instead of using free cash flows, which are hard to estimate and often not reported by analysts in this industry, dividends per share (DPS) payments are used. Unless a company pays out the majority of its FCF as a dividend, this method will typically underestimate the value of the stock. We use the Gordon Growth Model, which assumes dividend will grow into perpetuity at a rate that can be sustained. The dividend is expected to grow at an annual growth rate equal to the 5-year average of the 10-year government bond yield of 2.4%. We then discount this figure to today's value at a cost of equity of 6.1%. Relative to the current share price of US$88.4, the company appears about fair value at a 16% discount to where the stock price trades currently. The assumptions in any calculation have a big impact on the valuation, so it is better to view this as a rough estimate, not precise down to the last cent.
Value Per Share = Expected Dividend Per Share / (Discount Rate - Perpetual Growth Rate)
= US$3.9 / (6.1% – 2.4%)
= US$105
The Assumptions
The calculation above is very dependent on two assumptions. The first is the discount rate and the other is the cash flows. Part of investing is coming up with your own evaluation of a company's future performance, so try the calculation yourself and check your own assumptions. The DCF also does not consider the possible cyclicality of an industry, or a company's future capital requirements, so it does not give a full picture of a company's potential performance. Given that we are looking at American Electric Power Company as potential shareholders, the cost of equity is used as the discount rate, rather than the cost of capital (or weighted average cost of capital, WACC) which accounts for debt. In this calculation we've used 6.1%, which is based on a levered beta of 0.800. Beta is a measure of a stock's volatility, compared to the market as a whole. We get our beta from the industry average beta of globally comparable companies, with an imposed limit between 0.8 and 2.0, which is a reasonable range for a stable business.
SWOT Analysis for American Electric Power Company
Strength
Earnings growth over the past year exceeded the industry.
Weakness
Interest payments on debt are not well covered.
Dividend is low compared to the top 25% of dividend payers in the Electric Utilities market.
Shareholders have been diluted in the past year.
Opportunity
Annual earnings are forecast to grow for the next 3 years.
Good value based on P/E ratio and estimated fair value.
Threat
Debt is not well covered by operating cash flow.
Paying a dividend but company has no free cash flows.
Annual earnings are forecast to grow slower than the American market.
Next Steps:
Valuation is only one side of the coin in terms of building your investment thesis, and it is only one of many factors that you need to assess for a company. DCF models are not the be-all and end-all of investment valuation. Instead the best use for a DCF model is to test certain assumptions and theories to see if they would lead to the company being undervalued or overvalued. For instance, if the terminal value growth rate is adjusted slightly, it can dramatically alter the overall result. For American Electric Power Company, we've put together three relevant elements you should assess:
Risks: Take risks, for example - American Electric Power Company has 3 warning signs (and 1 which is a bit concerning) we think you should know about.
Future Earnings: How does AEP's growth rate compare to its peers and the wider market? Dig deeper into the analyst consensus number for the upcoming years by interacting with our free analyst growth expectation chart.
Other Solid Businesses: Low debt, high returns on equity and good past performance are fundamental to a strong business. Why not explore our interactive list of stocks with solid business fundamentals to see if there are other companies you may not have considered!
PS. The Simply Wall St app conducts a discounted cash flow valuation for every stock on the NASDAQGS every day. If you want to find the calculation for other stocks just search here.
Have feedback on this article? Concerned about the content? Get in touch with us directly. Alternatively, email editorial-team (at) simplywallst.com.
This article by Simply Wall St is general in nature. We provide commentary based on historical data and analyst forecasts only using an unbiased methodology and our articles are not intended to be financial advice. It does not constitute a recommendation to buy or sell any stock, and does not take account of your objectives, or your financial situation. We aim to bring you long-term focused analysis driven by fundamental data. Note that our analysis may not factor in the latest price-sensitive company announcements or qualitative material. Simply Wall St has no position in any stocks mentioned.
