
 Yahoo Finance
 Before You Buy Parex Resources Inc. (TSE:PXT), Consider Its Volatility

If you own shares in Parex Resources Inc. (TSE:PXT) then it's worth thinking about how it contributes to the volatility of your portfolio, overall. In finance, Beta is a measure of volatility. Modern finance theory considers volatility to be a measure of risk, and there are two main types of price volatility. The first category is company specific volatility. This can be dealt with by limiting your exposure to any particular stock. The second type is the broader market volatility, which you cannot diversify away, since it arises from macroeconomic factors which directly affects all the stocks on the market.
Some stocks are more sensitive to general market forces than others. Beta can be a useful tool to understand how much a stock is influenced by market risk (volatility). However, Warren Buffett said 'volatility is far from synonymous with risk' in his 2014 letter to investors. So, while useful, beta is not the only metric to consider. To use beta as an investor, you must first understand that the overall market has a beta of one. A stock with a beta below one is either less volatile than the market, or more volatile but not corellated with the overall market. In comparison a stock with a beta of over one tends to be move in a similar direction to the market in the long term, but with greater changes in price.
See our latest analysis for Parex Resources
What we can learn from PXT's beta value
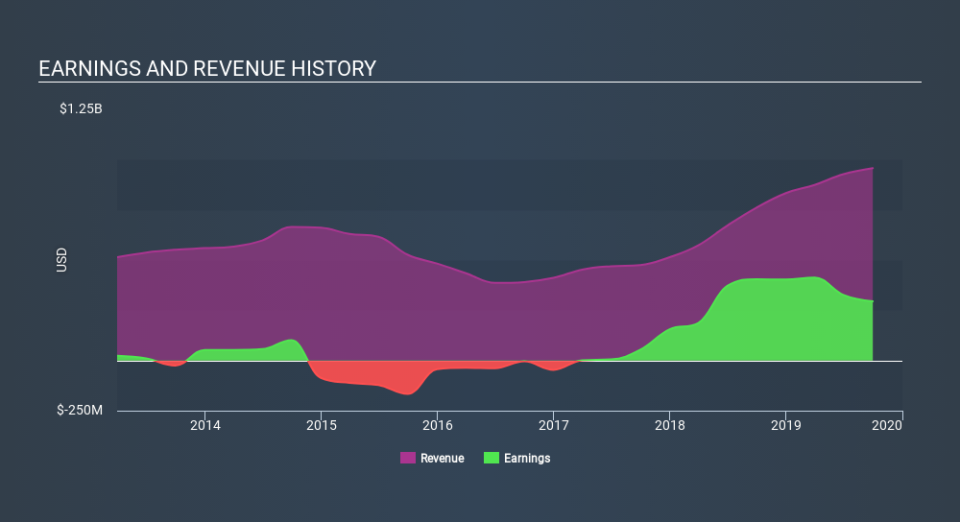
Given that it has a beta of 1.90, we can surmise that the Parex Resources share price has been fairly sensitive to market volatility (over the last 5 years). If this beta value holds true in the future, Parex Resources shares are likely to rise more than the market when the market is going up, but fall faster when the market is going down. Beta is worth considering, but it's also important to consider whether Parex Resources is growing earnings and revenue. You can take a look for yourself, below.
Does PXT's size influence the expected beta?
Parex Resources is a reasonably big company, with a market capitalisation of CA$3.4b. Most companies this size are actively traded with decent volumes of shares changing hands each day. It takes a lot of money to influence the share price of large companies like this one. That makes it interesting to note that its share price has a history of sensitivity to market volatility. There might be some aspect of the business that means profits are leveraged to the economic cycle.
What this means for you:
Since Parex Resources has a reasonably high beta, it's worth considering why it is so heavily influenced by broader market sentiment. For example, it might be a high growth stock or have a lot of operating leverage in its business model. This article aims to educate investors about beta values, but it's well worth looking at important company-specific fundamentals such as Parex Resources’s financial health and performance track record. I highly recommend you dive deeper by considering the following:
Financial Health: Are PXT’s operations financially sustainable? Balance sheets can be hard to analyze, which is why we’ve done it for you. Check out our financial health checks here.
Past Track Record: Has PXT been consistently performing well irrespective of the ups and downs in the market? Go into more detail in the past performance analysis and take a look at the free visual representations of PXT's historicals for more clarity.
Other High-Performing Stocks: Are there other stocks that provide better prospects with proven track records? Explore our free list of these great stocks here.
If you spot an error that warrants correction, please contact the editor at editorial-team@simplywallst.com. This article by Simply Wall St is general in nature. It does not constitute a recommendation to buy or sell any stock, and does not take account of your objectives, or your financial situation. Simply Wall St has no position in the stocks mentioned.
We aim to bring you long-term focused research analysis driven by fundamental data. Note that our analysis may not factor in the latest price-sensitive company announcements or qualitative material. Thank you for reading.
