
 Yahoo Finance
 Before You Buy GoGold Resources Inc (TSE:GGD), Consider Its Volatility

Anyone researching GoGold Resources Inc (TSE:GGD) might want to consider the historical volatility of the share price. Volatility is considered to be a measure of risk in modern finance theory. Investors may think of volatility as falling into two main categories. First, we have company specific volatility, which is the price gyrations of an individual stock. Holding at least 8 stocks can reduce this kind of risk across a portfolio. The second type is the broader market volatility, which you cannot diversify away, since it arises from macroeconomic factors which directly affects all the stocks on the market.
Some stocks mimic the volatility of the market quite closely, while others demonstrate muted, exagerrated or uncorrelated price movements. Some investors use beta as a measure of how much a certain stock is impacted by market risk (volatility). While we should keep in mind that Warren Buffett has cautioned that ‘Volatility is far from synonymous with risk’, beta is still a useful factor to consider. To make good use of it you must first know that the beta of the overall market is one. Any stock with a beta of greater than one is considered more volatile than the market, while those with a beta below one are either less volatile or poorly correlated with the market.
View our latest analysis for GoGold Resources
What GGD’s beta value tells investors
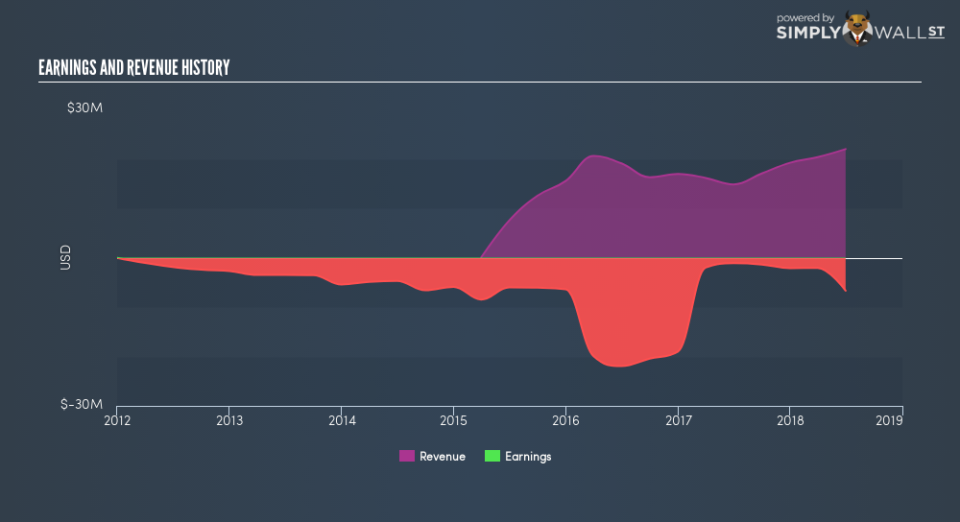
Zooming in on GoGold Resources, we see it has a five year beta of 1.14. This is above 1, so historically its share price has been influenced by the broader volatility of the stock market the market. If this beta value holds true in the future, GoGold Resources shares are likely to rise more than the market when the market is going up, but fall faster when the market is going down. Beta is worth considering, but it’s also important to consider whether GoGold Resources is growing earnings and revenue. You can take a look for yourself, below.
Could GGD’s size cause it to be more volatile?
With a market capitalisation of CA$40m, GoGold Resources is a very small company by global standards. It is quite likely to be unknown to most investors. It has a relatively high beta, suggesting it is fairly actively traded for a company of its size. Because it takes less capital to move the share price of a small company like this, when a stock this size is actively traded it is quite often more sensitive to market volatility than similar large companies.
What this means for you:
Since GoGold Resources has a reasonably high beta, it’s worth considering why it is so heavily influenced by broader market sentiment. For example, it might be a high growth stock or have a lot of operating leverage in its business model. This article aims to educate investors about beta values, but it’s well worth looking at important company-specific fundamentals such as GoGold Resources’s financial health and performance track record. I highly recommend you dive deeper by considering the following:
Financial Health: Are GGD’s operations financially sustainable? Balance sheets can be hard to analyze, which is why we’ve done it for you. Check out our financial health checks here.
Past Track Record: Has GGD been consistently performing well irrespective of the ups and downs in the market? Go into more detail in the past performance analysis and take a look at the free visual representations of GGD’s historicals for more clarity.
Other High-Performing Stocks: Are there other stocks that provide better prospects with proven track records? Explore our free list of these great stocks here.
To help readers see past the short term volatility of the financial market, we aim to bring you a long-term focused research analysis purely driven by fundamental data. Note that our analysis does not factor in the latest price-sensitive company announcements.
The author is an independent contributor and at the time of publication had no position in the stocks mentioned. For errors that warrant correction please contact the editor at editorial-team@simplywallst.com.
