
 Yahoo Finance
 Should You Buy Gamehost Inc. (TSE:GH) For Its 8.0% Dividend?

Dividend paying stocks like Gamehost Inc. (TSE:GH) tend to be popular with investors, and for good reason - some research suggests a significant amount of all stock market returns come from reinvested dividends. On the other hand, investors have been known to buy a stock because of its yield, and then lose money if the company's dividend doesn't live up to expectations.
A high yield and a long history of paying dividends is an appealing combination for Gamehost. It would not be a surprise to discover that many investors buy it for the dividends. During the year, the company also conducted a buyback equivalent to around 1.1% of its market capitalisation. Before you buy any stock for its dividend however, you should always remember Warren Buffett's two rules: 1) Don't lose money, and 2) Remember rule #1. We'll run through some checks below to help with this.
Click the interactive chart for our full dividend analysis
Payout ratios
Companies (usually) pay dividends out of their earnings. If a company is paying more than it earns, the dividend might have to be cut. As a result, we should always investigate whether a company can afford its dividend, measured as a percentage of a company's net income after tax. Gamehost paid out 106% of its profit as dividends, over the trailing twelve month period. A payout ratio above 100% is definitely an item of concern, unless there are some other circumstances that would justify it.
Another important check we do is to see if the free cash flow generated is sufficient to pay the dividend. Gamehost paid out 92% of its free cash flow last year, which we think is concerning if cash flows do not improve. Cash is slightly more important than profit from a dividend perspective, but given Gamehost's payments were not well covered by either earnings or cash flow, we are concerned about the sustainability of this dividend.
Is Gamehost's Balance Sheet Risky?
As Gamehost's dividend was not well covered by earnings, we need to check its balance sheet for signs of financial distress. A rough way to check this is with these two simple ratios: a) net debt divided by EBITDA (earnings before interest, tax, depreciation and amortisation), and b) net interest cover. Net debt to EBITDA measures total debt load relative to company earnings (lower = less debt), while net interest cover measures the ability to pay interest on the debt (higher = greater ability to pay interest costs). With net debt of 1.00 times its EBITDA, Gamehost has an acceptable level of debt.
We calculated its interest cover by measuring its earnings before interest and tax (EBIT), and dividing this by the company's net interest expense. Gamehost has interest cover of more than 12 times its interest expense, which we think is quite strong.
Consider getting our latest analysis on Gamehost's financial position here.
Dividend Volatility
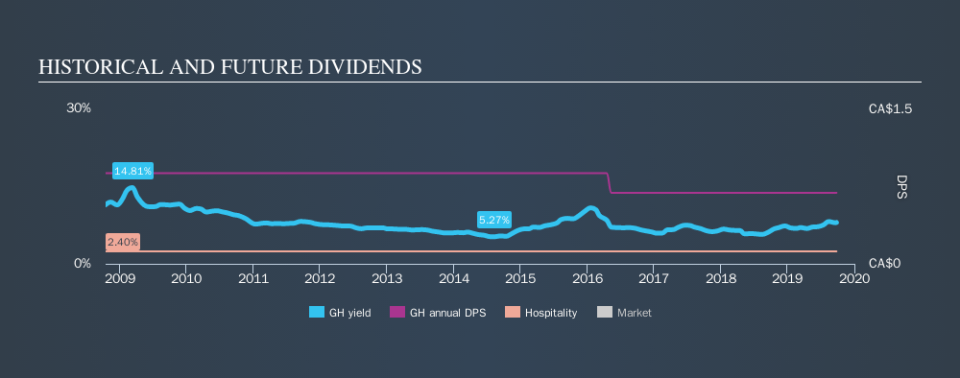
Before buying a stock for its income, we want to see if the dividends have been stable in the past, and if the company has a track record of maintaining its dividend. Gamehost has been paying dividends for a long time, but for the purpose of this analysis, we only examine the past 10 years of payments. This company's dividend has not fluctuated wildly, but its dividend per share payments have still decreased substantially over this time, which is not ideal. During the past ten-year period, the first annual payment was CA$0.88 in 2009, compared to CA$0.69 last year. This works out to be a decline of approximately 2.4% per year over that time.
We struggle to make a case for buying Gamehost for its dividend, given that payments have shrunk over the past ten years.
Dividend Growth Potential
While dividend payments have been relatively reliable, it would also be nice if earnings per share (EPS) were growing, as this is essential to maintaining the dividend's purchasing power over the long term. Over the past five years, it looks as though Gamehost's EPS have declined at around 5.7% a year. A modest decline in earnings per share is not great to see, but it doesn't automatically make a dividend unsustainable. Still, we'd vastly prefer to see EPS growth when researching dividend stocks.
Conclusion
To summarise, shareholders should always check that Gamehost's dividends are affordable, that its dividend payments are relatively stable, and that it has decent prospects for growing its earnings and dividend. Gamehost paid out almost all of its cash flow and profit as dividends, leaving little to reinvest in the business. Second, earnings per share have actually shrunk, but at least the dividends have been relatively stable. In this analysis, Gamehost doesn't shape up too well as a dividend stock. We'd find it hard to look past the flaws, and would not be inclined to think of it as a reliable dividend-payer.
Are management backing themselves to deliver performance? Check their shareholdings in Gamehost in our latest insider ownership analysis.
Looking for more high-yielding dividend ideas? Try our curated list of dividend stocks with a yield above 3%.
We aim to bring you long-term focused research analysis driven by fundamental data. Note that our analysis may not factor in the latest price-sensitive company announcements or qualitative material.
If you spot an error that warrants correction, please contact the editor at editorial-team@simplywallst.com. This article by Simply Wall St is general in nature. It does not constitute a recommendation to buy or sell any stock, and does not take account of your objectives, or your financial situation. Simply Wall St has no position in the stocks mentioned. Thank you for reading.
