
 Yahoo Finance
 Burlington Stores (NYSE:BURL) Will Be Hoping To Turn Its Returns On Capital Around
To find a multi-bagger stock, what are the underlying trends we should look for in a business? Typically, we'll want to notice a trend of growing return on capital employed (ROCE) and alongside that, an expanding base of capital employed. Basically this means that a company has profitable initiatives that it can continue to reinvest in, which is a trait of a compounding machine. However, after briefly looking over the numbers, we don't think Burlington Stores (NYSE:BURL) has the makings of a multi-bagger going forward, but let's have a look at why that may be.
What Is Return On Capital Employed (ROCE)?
If you haven't worked with ROCE before, it measures the 'return' (pre-tax profit) a company generates from capital employed in its business. The formula for this calculation on Burlington Stores is:
Return on Capital Employed = Earnings Before Interest and Tax (EBIT) ÷ (Total Assets - Current Liabilities)
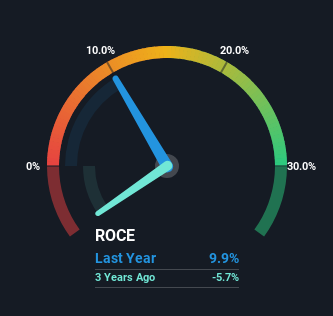
0.099 = US$563m ÷ (US$7.7b - US$2.0b) (Based on the trailing twelve months to February 2024).
Therefore, Burlington Stores has an ROCE of 9.9%. Ultimately, that's a low return and it under-performs the Specialty Retail industry average of 13%.
See our latest analysis for Burlington Stores
Above you can see how the current ROCE for Burlington Stores compares to its prior returns on capital, but there's only so much you can tell from the past. If you'd like, you can check out the forecasts from the analysts covering Burlington Stores for free.
What The Trend Of ROCE Can Tell Us
The trend of ROCE doesn't look fantastic because it's fallen from 32% five years ago, while the business's capital employed increased by 207%. Usually this isn't ideal, but given Burlington Stores conducted a capital raising before their most recent earnings announcement, that would've likely contributed, at least partially, to the increased capital employed figure. The funds raised likely haven't been put to work yet so it's worth watching what happens in the future with Burlington Stores' earnings and if they change as a result from the capital raise.
On a side note, Burlington Stores has done well to pay down its current liabilities to 26% of total assets. So we could link some of this to the decrease in ROCE. What's more, this can reduce some aspects of risk to the business because now the company's suppliers or short-term creditors are funding less of its operations. Since the business is basically funding more of its operations with it's own money, you could argue this has made the business less efficient at generating ROCE.
The Bottom Line On Burlington Stores' ROCE
In summary, despite lower returns in the short term, we're encouraged to see that Burlington Stores is reinvesting for growth and has higher sales as a result. These trends are starting to be recognized by investors since the stock has delivered a 27% gain to shareholders who've held over the last five years. So this stock may still be an appealing investment opportunity, if other fundamentals prove to be sound.
On a final note, we've found 2 warning signs for Burlington Stores that we think you should be aware of.
While Burlington Stores isn't earning the highest return, check out this free list of companies that are earning high returns on equity with solid balance sheets.
Have feedback on this article? Concerned about the content? Get in touch with us directly. Alternatively, email editorial-team (at) simplywallst.com.
This article by Simply Wall St is general in nature. We provide commentary based on historical data and analyst forecasts only using an unbiased methodology and our articles are not intended to be financial advice. It does not constitute a recommendation to buy or sell any stock, and does not take account of your objectives, or your financial situation. We aim to bring you long-term focused analysis driven by fundamental data. Note that our analysis may not factor in the latest price-sensitive company announcements or qualitative material. Simply Wall St has no position in any stocks mentioned.
