
 Yahoo Finance
 Bumi Armada Berhad (KLSE:ARMADA) shareholders are up 11% this past week, but still in the red over the last five years
Bumi Armada Berhad (KLSE:ARMADA) shareholders will doubtless be very grateful to see the share price up 39% in the last quarter. But if you look at the last five years the returns have not been good. In fact, the share price is down 37%, which falls well short of the return you could get by buying an index fund.
While the stock has risen 11% in the past week but long term shareholders are still in the red, let's see what the fundamentals can tell us.
Check out our latest analysis for Bumi Armada Berhad
In his essay The Superinvestors of Graham-and-Doddsville Warren Buffett described how share prices do not always rationally reflect the value of a business. By comparing earnings per share (EPS) and share price changes over time, we can get a feel for how investor attitudes to a company have morphed over time.
During five years of share price growth, Bumi Armada Berhad moved from a loss to profitability. Most would consider that to be a good thing, so it's counter-intuitive to see the share price declining. Other metrics might give us a better handle on how its value is changing over time.
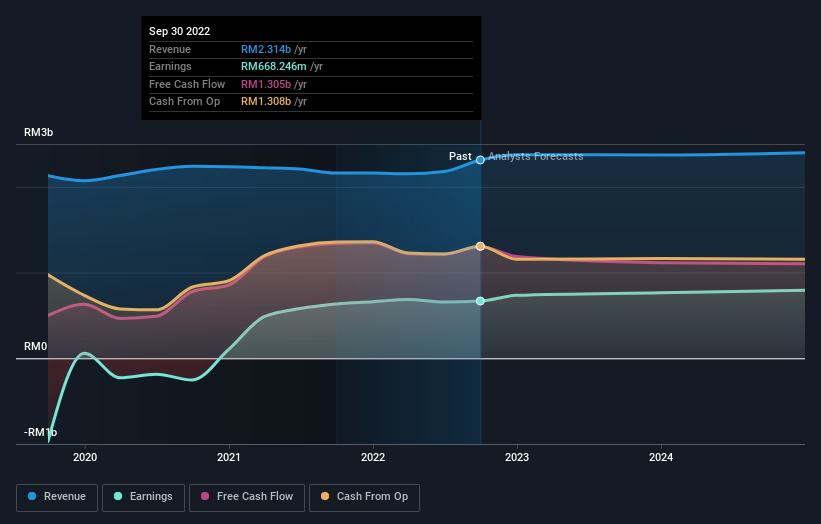
The revenue fall of 1.5% per year for five years is neither good nor terrible. But it's quite possible the market had expected better; a closer look at the revenue trends might explain the pessimism.
The graphic below depicts how earnings and revenue have changed over time (unveil the exact values by clicking on the image).
Bumi Armada Berhad is well known by investors, and plenty of clever analysts have tried to predict the future profit levels. Given we have quite a good number of analyst forecasts, it might be well worth checking out this free chart depicting consensus estimates.
A Different Perspective
We're pleased to report that Bumi Armada Berhad shareholders have received a total shareholder return of 2.0% over one year. There's no doubt those recent returns are much better than the TSR loss of 6% per year over five years. The long term loss makes us cautious, but the short term TSR gain certainly hints at a brighter future. While it is well worth considering the different impacts that market conditions can have on the share price, there are other factors that are even more important. Take risks, for example - Bumi Armada Berhad has 1 warning sign we think you should be aware of.
But note: Bumi Armada Berhad may not be the best stock to buy. So take a peek at this free list of interesting companies with past earnings growth (and further growth forecast).
Please note, the market returns quoted in this article reflect the market weighted average returns of stocks that currently trade on MY exchanges.
Have feedback on this article? Concerned about the content? Get in touch with us directly. Alternatively, email editorial-team (at) simplywallst.com.
This article by Simply Wall St is general in nature. We provide commentary based on historical data and analyst forecasts only using an unbiased methodology and our articles are not intended to be financial advice. It does not constitute a recommendation to buy or sell any stock, and does not take account of your objectives, or your financial situation. We aim to bring you long-term focused analysis driven by fundamental data. Note that our analysis may not factor in the latest price-sensitive company announcements or qualitative material. Simply Wall St has no position in any stocks mentioned.
Join A Paid User Research Session
You’ll receive a US$30 Amazon Gift card for 1 hour of your time while helping us build better investing tools for the individual investors like yourself. Sign up here
