
 Yahoo Finance
 Buhler Industries (TSE:BUI) Is Experiencing Growth In Returns On Capital
If you're looking for a multi-bagger, there's a few things to keep an eye out for. Amongst other things, we'll want to see two things; firstly, a growing return on capital employed (ROCE) and secondly, an expansion in the company's amount of capital employed. This shows us that it's a compounding machine, able to continually reinvest its earnings back into the business and generate higher returns. Speaking of which, we noticed some great changes in Buhler Industries' (TSE:BUI) returns on capital, so let's have a look.
What Is Return On Capital Employed (ROCE)?
For those who don't know, ROCE is a measure of a company's yearly pre-tax profit (its return), relative to the capital employed in the business. To calculate this metric for Buhler Industries, this is the formula:
Return on Capital Employed = Earnings Before Interest and Tax (EBIT) ÷ (Total Assets - Current Liabilities)
0.021 = CA$2.8m ÷ (CA$233m - CA$97m) (Based on the trailing twelve months to June 2023).
Therefore, Buhler Industries has an ROCE of 2.1%. Ultimately, that's a low return and it under-performs the Machinery industry average of 8.1%.
View our latest analysis for Buhler Industries
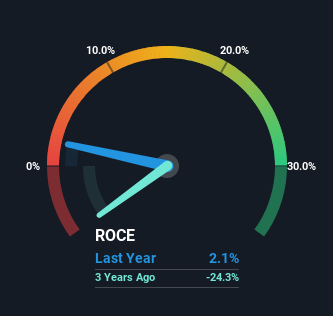
Historical performance is a great place to start when researching a stock so above you can see the gauge for Buhler Industries' ROCE against it's prior returns. If you're interested in investigating Buhler Industries' past further, check out this free graph of past earnings, revenue and cash flow.
What Can We Tell From Buhler Industries' ROCE Trend?
We're delighted to see that Buhler Industries is reaping rewards from its investments and has now broken into profitability. While the business is profitable now, it used to be incurring losses on invested capital five years ago. Additionally, the business is utilizing 21% less capital than it was five years ago, and taken at face value, that can mean the company needs less funds at work to get a return. This could potentially mean that the company is selling some of its assets.
Another thing to note, Buhler Industries has a high ratio of current liabilities to total assets of 42%. This effectively means that suppliers (or short-term creditors) are funding a large portion of the business, so just be aware that this can introduce some elements of risk. While it's not necessarily a bad thing, it can be beneficial if this ratio is lower.
What We Can Learn From Buhler Industries' ROCE
In a nutshell, we're pleased to see that Buhler Industries has been able to generate higher returns from less capital. Given the stock has declined 35% in the last five years, this could be a good investment if the valuation and other metrics are also appealing. That being the case, research into the company's current valuation metrics and future prospects seems fitting.
If you want to know some of the risks facing Buhler Industries we've found 3 warning signs (2 are potentially serious!) that you should be aware of before investing here.
While Buhler Industries may not currently earn the highest returns, we've compiled a list of companies that currently earn more than 25% return on equity. Check out this free list here.
Have feedback on this article? Concerned about the content? Get in touch with us directly. Alternatively, email editorial-team (at) simplywallst.com.
This article by Simply Wall St is general in nature. We provide commentary based on historical data and analyst forecasts only using an unbiased methodology and our articles are not intended to be financial advice. It does not constitute a recommendation to buy or sell any stock, and does not take account of your objectives, or your financial situation. We aim to bring you long-term focused analysis driven by fundamental data. Note that our analysis may not factor in the latest price-sensitive company announcements or qualitative material. Simply Wall St has no position in any stocks mentioned.
