
 Yahoo Finance
 Brickability Group Plc's (LON:BRCK) Stock's On An Uptrend: Are Strong Financials Guiding The Market?
Brickability Group (LON:BRCK) has had a great run on the share market with its stock up by a significant 26% over the last three months. Given the company's impressive performance, we decided to study its financial indicators more closely as a company's financial health over the long-term usually dictates market outcomes. In this article, we decided to focus on Brickability Group's ROE.
Return on Equity or ROE is a test of how effectively a company is growing its value and managing investors’ money. In simpler terms, it measures the profitability of a company in relation to shareholder's equity.
View our latest analysis for Brickability Group
How Is ROE Calculated?
The formula for return on equity is:
Return on Equity = Net Profit (from continuing operations) ÷ Shareholders' Equity
So, based on the above formula, the ROE for Brickability Group is:
15% = UK£28m ÷ UK£181m (Based on the trailing twelve months to September 2023).
The 'return' is the income the business earned over the last year. So, this means that for every £1 of its shareholder's investments, the company generates a profit of £0.15.
What Is The Relationship Between ROE And Earnings Growth?
We have already established that ROE serves as an efficient profit-generating gauge for a company's future earnings. Based on how much of its profits the company chooses to reinvest or "retain", we are then able to evaluate a company's future ability to generate profits. Assuming all else is equal, companies that have both a higher return on equity and higher profit retention are usually the ones that have a higher growth rate when compared to companies that don't have the same features.
Brickability Group's Earnings Growth And 15% ROE
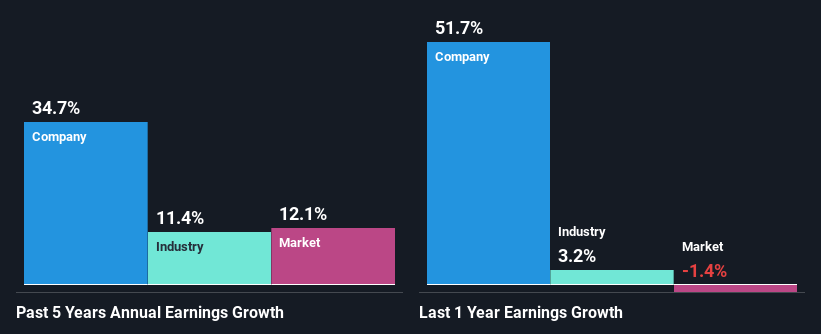
To begin with, Brickability Group seems to have a respectable ROE. Further, the company's ROE compares quite favorably to the industry average of 11%. This probably laid the ground for Brickability Group's significant 35% net income growth seen over the past five years. However, there could also be other causes behind this growth. Such as - high earnings retention or an efficient management in place.
We then compared Brickability Group's net income growth with the industry and we're pleased to see that the company's growth figure is higher when compared with the industry which has a growth rate of 11% in the same 5-year period.
The basis for attaching value to a company is, to a great extent, tied to its earnings growth. The investor should try to establish if the expected growth or decline in earnings, whichever the case may be, is priced in. Doing so will help them establish if the stock's future looks promising or ominous. If you're wondering about Brickability Group's's valuation, check out this gauge of its price-to-earnings ratio, as compared to its industry.
Is Brickability Group Using Its Retained Earnings Effectively?
The three-year median payout ratio for Brickability Group is 48%, which is moderately low. The company is retaining the remaining 52%. This suggests that its dividend is well covered, and given the high growth we discussed above, it looks like Brickability Group is reinvesting its earnings efficiently.
Besides, Brickability Group has been paying dividends over a period of four years. This shows that the company is committed to sharing profits with its shareholders. Upon studying the latest analysts' consensus data, we found that the company's future payout ratio is expected to drop to 33% over the next three years. Accordingly, the expected drop in the payout ratio explains the expected increase in the company's ROE to 19%, over the same period.
Summary
Overall, we are quite pleased with Brickability Group's performance. In particular, it's great to see that the company is investing heavily into its business and along with a high rate of return, that has resulted in a sizeable growth in its earnings. That being so, according to the latest industry analyst forecasts, the company's earnings are expected to shrink in the future. To know more about the latest analysts predictions for the company, check out this visualization of analyst forecasts for the company.
Have feedback on this article? Concerned about the content? Get in touch with us directly. Alternatively, email editorial-team (at) simplywallst.com.
This article by Simply Wall St is general in nature. We provide commentary based on historical data and analyst forecasts only using an unbiased methodology and our articles are not intended to be financial advice. It does not constitute a recommendation to buy or sell any stock, and does not take account of your objectives, or your financial situation. We aim to bring you long-term focused analysis driven by fundamental data. Note that our analysis may not factor in the latest price-sensitive company announcements or qualitative material. Simply Wall St has no position in any stocks mentioned.
