
 Yahoo Finance
 Bri-Chem (TSE:BRY) Might Have The Makings Of A Multi-Bagger
If you're looking for a multi-bagger, there's a few things to keep an eye out for. One common approach is to try and find a company with returns on capital employed (ROCE) that are increasing, in conjunction with a growing amount of capital employed. Basically this means that a company has profitable initiatives that it can continue to reinvest in, which is a trait of a compounding machine. With that in mind, we've noticed some promising trends at Bri-Chem (TSE:BRY) so let's look a bit deeper.
Return On Capital Employed (ROCE): What is it?
For those that aren't sure what ROCE is, it measures the amount of pre-tax profits a company can generate from the capital employed in its business. To calculate this metric for Bri-Chem, this is the formula:
Return on Capital Employed = Earnings Before Interest and Tax (EBIT) ÷ (Total Assets - Current Liabilities)
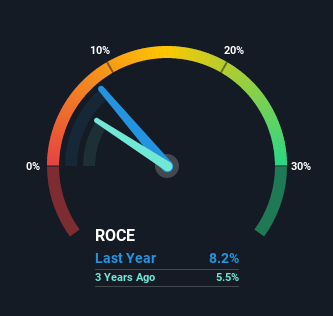
0.082 = CA$1.4m ÷ (CA$37m - CA$19m) (Based on the trailing twelve months to September 2021).
So, Bri-Chem has an ROCE of 8.2%. Ultimately, that's a low return and it under-performs the Trade Distributors industry average of 17%.
View our latest analysis for Bri-Chem
While the past is not representative of the future, it can be helpful to know how a company has performed historically, which is why we have this chart above. If you're interested in investigating Bri-Chem's past further, check out this free graph of past earnings, revenue and cash flow.
So How Is Bri-Chem's ROCE Trending?
Bri-Chem has not disappointed in regards to ROCE growth. The data shows that returns on capital have increased by 509% over the trailing five years. That's not bad because this tells for every dollar invested (capital employed), the company is increasing the amount earned from that dollar. Speaking of capital employed, the company is actually utilizing 57% less than it was five years ago, which can be indicative of a business that's improving its efficiency. Bri-Chem may be selling some assets so it's worth investigating if the business has plans for future investments to increase returns further still.
On a side note, we noticed that the improvement in ROCE appears to be partly fueled by an increase in current liabilities. Effectively this means that suppliers or short-term creditors are now funding 53% of the business, which is more than it was five years ago. And with current liabilities at those levels, that's pretty high.
What We Can Learn From Bri-Chem's ROCE
In the end, Bri-Chem has proven it's capital allocation skills are good with those higher returns from less amount of capital. Given the stock has declined 38% in the last five years, this could be a good investment if the valuation and other metrics are also appealing. With that in mind, we believe the promising trends warrant this stock for further investigation.
On a final note, we found 2 warning signs for Bri-Chem (1 makes us a bit uncomfortable) you should be aware of.
If you want to search for solid companies with great earnings, check out this free list of companies with good balance sheets and impressive returns on equity.
This article by Simply Wall St is general in nature. We provide commentary based on historical data and analyst forecasts only using an unbiased methodology and our articles are not intended to be financial advice. It does not constitute a recommendation to buy or sell any stock, and does not take account of your objectives, or your financial situation. We aim to bring you long-term focused analysis driven by fundamental data. Note that our analysis may not factor in the latest price-sensitive company announcements or qualitative material. Simply Wall St has no position in any stocks mentioned.
Have feedback on this article? Concerned about the content? Get in touch with us directly. Alternatively, email editorial-team (at) simplywallst.com.
