
 Yahoo Finance
 Breakeven On The Horizon For UGE International Ltd. (CVE:UGE)
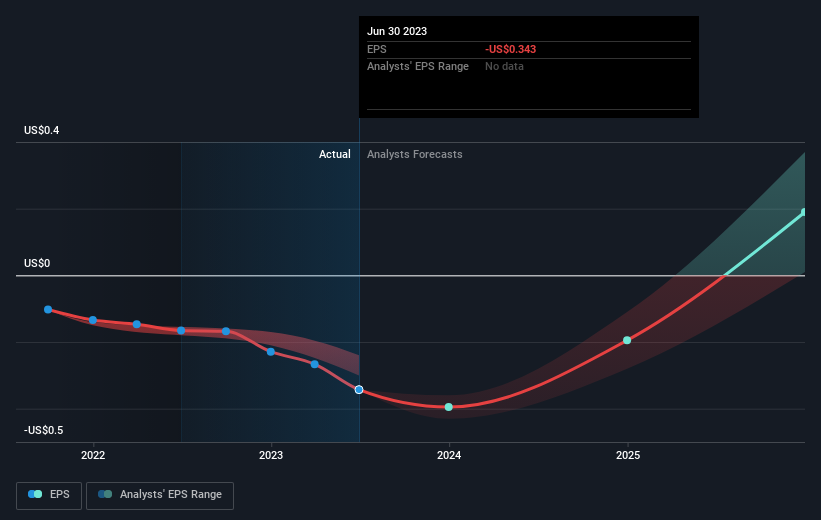
We feel now is a pretty good time to analyse UGE International Ltd.'s (CVE:UGE) business as it appears the company may be on the cusp of a considerable accomplishment. UGE International Ltd. develops, builds, finances, owns, and operates commercial and community solar facilities in Canada, the United States, and the Philippines. The CA$51m market-cap company posted a loss in its most recent financial year of US$7.4m and a latest trailing-twelve-month loss of US$11m leading to an even wider gap between loss and breakeven. Many investors are wondering about the rate at which UGE International will turn a profit, with the big question being “when will the company breakeven?” We've put together a brief outline of industry analyst expectations for the company, its year of breakeven and its implied growth rate.
View our latest analysis for UGE International
UGE International is bordering on breakeven, according to the 4 Canadian Construction analysts. They anticipate the company to incur a final loss in 2024, before generating positive profits of US$7.4m in 2025. The company is therefore projected to breakeven around 2 years from now. In order to meet this breakeven date, we calculated the rate at which the company must grow year-on-year. It turns out an average annual growth rate of 65% is expected, which signals high confidence from analysts. Should the business grow at a slower rate, it will become profitable at a later date than expected.
Underlying developments driving UGE International's growth isn’t the focus of this broad overview, but, keep in mind that generally a high growth rate is not out of the ordinary, particularly when a company is in a period of investment.
One thing we would like to bring into light with UGE International is it currently has negative equity on its balance sheet. This can sometimes arise from accounting methods used to deal with accumulated losses from prior years, which are viewed as liabilities carried forward until it cancels out in the future. Oftentimes, losses exist only on paper but other times, it can be a red flag.
Next Steps:
There are key fundamentals of UGE International which are not covered in this article, but we must stress again that this is merely a basic overview. For a more comprehensive look at UGE International, take a look at UGE International's company page on Simply Wall St. We've also put together a list of key aspects you should further examine:
Historical Track Record: What has UGE International's performance been like over the past? Go into more detail in the past track record analysis and take a look at the free visual representations of our analysis for more clarity.
Management Team: An experienced management team on the helm increases our confidence in the business – take a look at who sits on UGE International's board and the CEO’s background.
Other High-Performing Stocks: Are there other stocks that provide better prospects with proven track records? Explore our free list of these great stocks here.
Have feedback on this article? Concerned about the content? Get in touch with us directly. Alternatively, email editorial-team (at) simplywallst.com.
This article by Simply Wall St is general in nature. We provide commentary based on historical data and analyst forecasts only using an unbiased methodology and our articles are not intended to be financial advice. It does not constitute a recommendation to buy or sell any stock, and does not take account of your objectives, or your financial situation. We aim to bring you long-term focused analysis driven by fundamental data. Note that our analysis may not factor in the latest price-sensitive company announcements or qualitative material. Simply Wall St has no position in any stocks mentioned.
