
 Yahoo Finance
 Breakeven On The Horizon For Aurinia Pharmaceuticals Inc (NASDAQ:AUPH)

Aurinia Pharmaceuticals Inc’s (NASDAQ:AUPH): Aurinia Pharmaceuticals Inc., a clinical stage biopharmaceutical company, engages in the research, development, and commercialization of therapeutic drugs for the treatment of autoimmune diseases in Canada, the United States, China, and Switzerland. With the latest financial year loss of -US$70.79M and a trailing-twelve month of -US$34.33M, the US$471.83M market-cap alleviates its loss by moving closer towards its target of breakeven. Many investors are wondering the rate at which AUPH will turn a profit, with the big question being “when will the company breakeven?” I’ve put together a brief outline of industry analyst expectations for AUPH, its year of breakeven and its implied growth rate.
Check out our latest analysis for Aurinia Pharmaceuticals
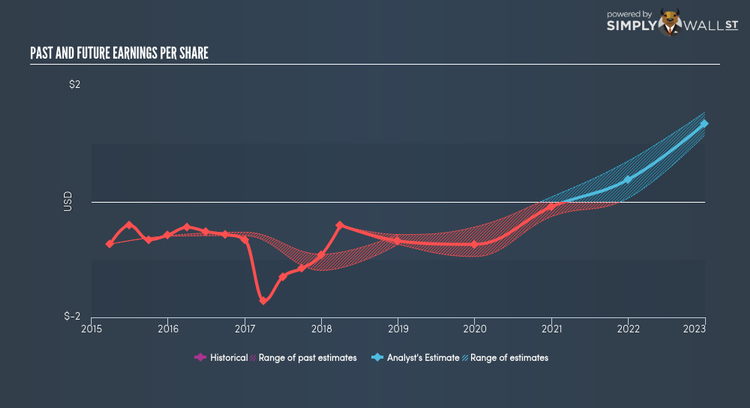
AUPH is bordering on breakeven, according to analysts. They expect the company to post a final loss in 2020, before turning a profit of US$36.87M in 2021. Therefore, AUPH is expected to breakeven roughly 3 years from today. In order to meet this breakeven date, I calculated the rate at which AUPH must grow year-on-year. It turns out an average annual growth rate of 71.13% is expected, which is rather optimistic! If this rate turns out to be too aggressive, AUPH may become profitable much later than analysts predict.
Underlying developments driving AUPH’s growth isn’t the focus of this broad overview, however, bear in mind that generally a biotech has lumpy cash flows which are contingent on the product type and stage of development the company is in. This means that a high growth rate is not unusual, especially if the company is currently in an investment period.
Before I wrap up, there’s one aspect worth mentioning. AUPH currently has no debt on its balance sheet, which is rare for a loss-making biotech, which usually has a high level of debt relative to its equity. This means that AUPH has been operating purely on its equity investment and has no debt burden. This aspect reduces the risk around investing in the loss-making company.
Next Steps:
This article is not intended to be a comprehensive analysis on AUPH, so if you are interested in understanding the company at a deeper level, take a look at AUPH’s company page on Simply Wall St. I’ve also compiled a list of pertinent aspects you should further examine:
Valuation: What is AUPH worth today? Has the future growth potential already been factored into the price? The intrinsic value infographic in our free research report helps visualize whether AUPH is currently mispriced by the market.
Management Team: An experienced management team on the helm increases our confidence in the business – take a look at who sits on Aurinia Pharmaceuticals’s board and the CEO’s back ground.
Other High-Performing Stocks: Are there other stocks that provide better prospects with proven track records? Explore our free list of these great stocks here.
To help readers see pass the short term volatility of the financial market, we aim to bring you a long-term focused research analysis purely driven by fundamental data. Note that our analysis does not factor in the latest price sensitive company announcements.
The author is an independent contributor and at the time of publication had no position in the stocks mentioned.
