
 Yahoo Finance
 Brady's (NYSE:BRC) five-year earnings growth trails the 7.9% YoY shareholder returns
The main point of investing for the long term is to make money. Furthermore, you'd generally like to see the share price rise faster than the market. But Brady Corporation (NYSE:BRC) has fallen short of that second goal, with a share price rise of 33% over five years, which is below the market return. The last year has been disappointing, with the stock price down 3.1% in that time.
Since the stock has added US$140m to its market cap in the past week alone, let's see if underlying performance has been driving long-term returns.
See our latest analysis for Brady
While markets are a powerful pricing mechanism, share prices reflect investor sentiment, not just underlying business performance. One way to examine how market sentiment has changed over time is to look at the interaction between a company's share price and its earnings per share (EPS).
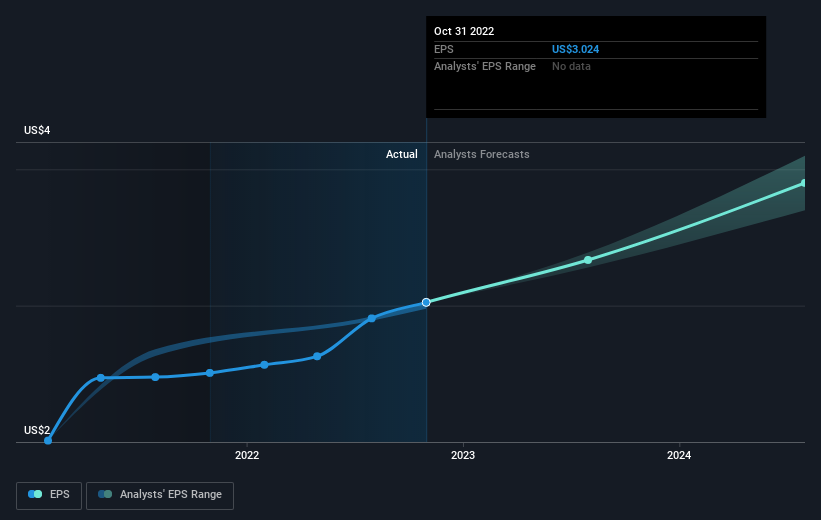
During five years of share price growth, Brady achieved compound earnings per share (EPS) growth of 10% per year. The EPS growth is more impressive than the yearly share price gain of 6% over the same period. Therefore, it seems the market has become relatively pessimistic about the company.
The image below shows how EPS has tracked over time (if you click on the image you can see greater detail).
We like that insiders have been buying shares in the last twelve months. Even so, future earnings will be far more important to whether current shareholders make money. Before buying or selling a stock, we always recommend a close examination of historic growth trends, available here..
What About Dividends?
As well as measuring the share price return, investors should also consider the total shareholder return (TSR). The TSR is a return calculation that accounts for the value of cash dividends (assuming that any dividend received was reinvested) and the calculated value of any discounted capital raisings and spin-offs. Arguably, the TSR gives a more comprehensive picture of the return generated by a stock. We note that for Brady the TSR over the last 5 years was 46%, which is better than the share price return mentioned above. This is largely a result of its dividend payments!
A Different Perspective
While it's certainly disappointing to see that Brady shares lost 1.2% throughout the year, that wasn't as bad as the market loss of 15%. Longer term investors wouldn't be so upset, since they would have made 8%, each year, over five years. It could be that the business is just facing some short term problems, but shareholders should keep a close eye on the fundamentals. Investors who like to make money usually check up on insider purchases, such as the price paid, and total amount bought. You can find out about the insider purchases of Brady by clicking this link.
There are plenty of other companies that have insiders buying up shares. You probably do not want to miss this free list of growing companies that insiders are buying.
Please note, the market returns quoted in this article reflect the market weighted average returns of stocks that currently trade on US exchanges.
Have feedback on this article? Concerned about the content? Get in touch with us directly. Alternatively, email editorial-team (at) simplywallst.com.
This article by Simply Wall St is general in nature. We provide commentary based on historical data and analyst forecasts only using an unbiased methodology and our articles are not intended to be financial advice. It does not constitute a recommendation to buy or sell any stock, and does not take account of your objectives, or your financial situation. We aim to bring you long-term focused analysis driven by fundamental data. Note that our analysis may not factor in the latest price-sensitive company announcements or qualitative material. Simply Wall St has no position in any stocks mentioned.
Join A Paid User Research Session
You’ll receive a US$30 Amazon Gift card for 1 hour of your time while helping us build better investing tools for the individual investors like yourself. Sign up here