
 Yahoo Finance
 Are BP plc’s (LON:BP.) Interest Costs Too High?

The size of BP plc (LON:BP.), a UK£109.10b large-cap, often attracts investors seeking a reliable investment in the stock market. Risk-averse investors who are attracted to diversified streams of revenue and strong capital returns tend to seek out these large companies. However, the key to their continued success lies in its financial health. I will provide an overview of BP’s financial liquidity and leverage to give you an idea of BP’s position to take advantage of potential acquisitions or comfortably endure future downturns. Note that this commentary is very high-level and solely focused on financial health, so I suggest you dig deeper yourself into BP. here.
View our latest analysis for BP
Does BP. produce enough cash relative to debt?
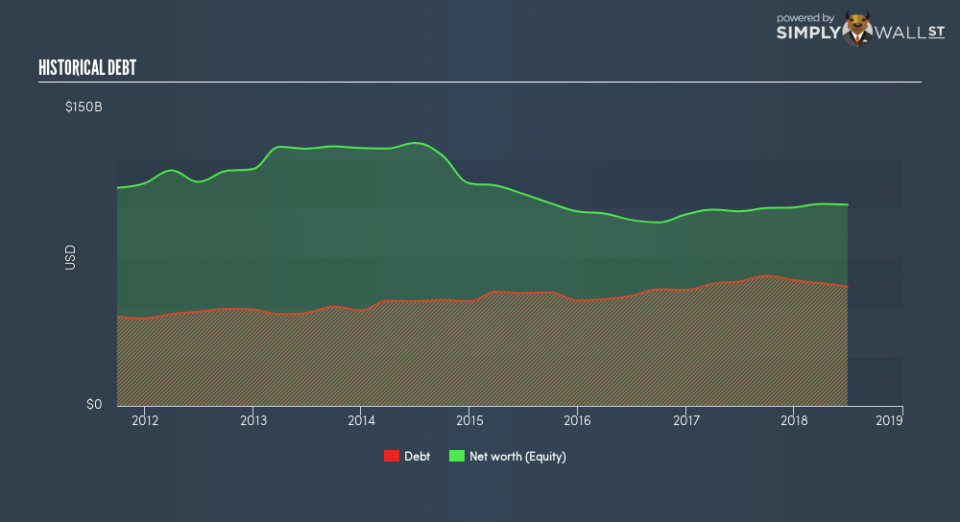
BP. has sustained its debt level by about US$60.36b over the last 12 months – this includes both the current and long-term debt. At this stable level of debt, BP.’s cash and short-term investments stands at US$22.29b for investing into the business. Additionally, BP. has produced cash from operations of US$21.88b during the same period of time, leading to an operating cash to total debt ratio of 36.2%, meaning that BP.’s current level of operating cash is high enough to cover debt. This ratio can also be interpreted as a measure of efficiency as an alternative to return on assets. In BP.’s case, it is able to generate 0.36x cash from its debt capital.
Can BP. meet its short-term obligations with the cash in hand?
Looking at BP.’s most recent US$69.53b liabilities, the company has been able to meet these obligations given the level of current assets of US$76.69b, with a current ratio of 1.1x. Generally, for Oil and Gas companies, this is a reasonable ratio since there’s sufficient cash cushion without leaving too much capital idle or in low-earning investments.
Does BP. face the risk of succumbing to its debt-load?
With debt reaching 59.3% of equity, BP. may be thought of as relatively highly levered. This isn’t surprising for large-caps, as equity can often be more expensive to issue than debt, plus interest payments are tax deductible. Accordingly, large companies often have lower cost of capital due to easily obtained financing, providing an advantage over smaller companies. We can check to see whether BP. is able to meet its debt obligations by looking at the net interest coverage ratio. Ideally, earnings before interest and tax (EBIT) should cover net interest by at least three times. In BP.’s case, the ratio of 10.88x suggests that interest is amply covered. High interest coverage is seen as a responsible and safe practice, which highlights why most investors believe large-caps such as BP. is a safe investment.
Next Steps:
Although BP.’s debt level is towards the higher end of the spectrum, its cash flow coverage seems adequate to meet obligations which means its debt is being efficiently utilised. Since there is also no concerns around BP.’s liquidity needs, this may be its optimal capital structure for the time being. This is only a rough assessment of financial health, and I’m sure BP. has company-specific issues impacting its capital structure decisions. I suggest you continue to research BP to get a more holistic view of the large-cap by looking at:
Future Outlook: What are well-informed industry analysts predicting for BP.’s future growth? Take a look at our free research report of analyst consensus for BP.’s outlook.
Valuation: What is BP. worth today? Is the stock undervalued, even when its growth outlook is factored into its intrinsic value? The intrinsic value infographic in our free research report helps visualize whether BP. is currently mispriced by the market.
Other High-Performing Stocks: Are there other stocks that provide better prospects with proven track records? Explore our free list of these great stocks here.
To help readers see past the short term volatility of the financial market, we aim to bring you a long-term focused research analysis purely driven by fundamental data. Note that our analysis does not factor in the latest price-sensitive company announcements.
The author is an independent contributor and at the time of publication had no position in the stocks mentioned. For errors that warrant correction please contact the editor at editorial-team@simplywallst.com.
