
 Yahoo Finance
 Is Bonterra Energy Corp’s (TSE:BNE) Balance Sheet A Threat To Its Future?

While small-cap stocks, such as Bonterra Energy Corp (TSE:BNE) with its market cap of CA$545.96m, are popular for their explosive growth, investors should also be aware of their balance sheet to judge whether the company can survive a downturn. Oil and Gas companies, even ones that are profitable, tend to be high risk. Assessing first and foremost the financial health is crucial. Here are a few basic checks that are good enough to have a broad overview of the company’s financial strength. However, given that I have not delve into the company-specifics, I’d encourage you to dig deeper yourself into BNE here.
How does BNE’s operating cash flow stack up against its debt?
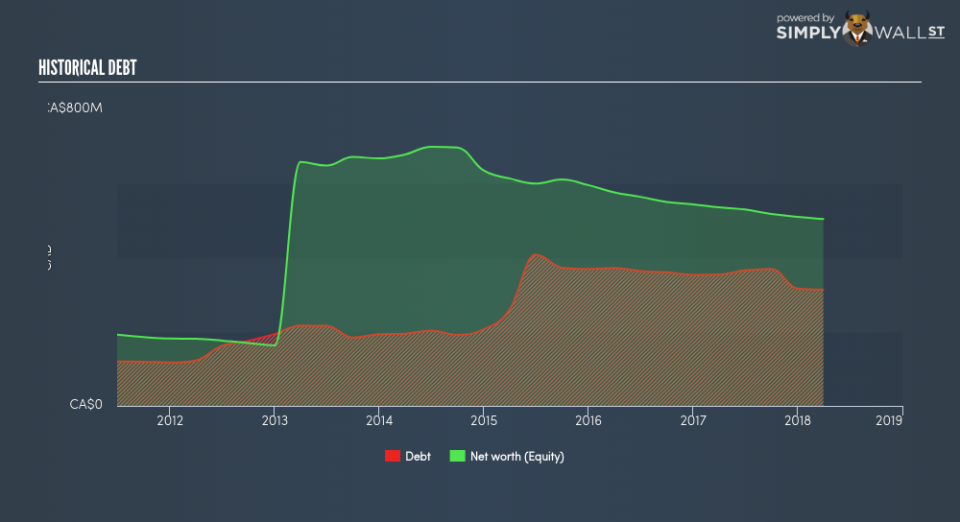
BNE has shrunken its total debt levels in the last twelve months, from CA$353.70m to CA$316.71m , which is made up of current and long term debt. With this reduction in debt, the current cash and short-term investment levels stands at CA$274.00k , ready to deploy into the business. On top of this, BNE has produced CA$103.87m in operating cash flow in the last twelve months, resulting in an operating cash to total debt ratio of 32.80%, meaning that BNE’s debt is appropriately covered by operating cash. This ratio can also be a sign of operational efficiency as an alternative to return on assets. In BNE’s case, it is able to generate 0.33x cash from its debt capital.
Can BNE pay its short-term liabilities?
Looking at BNE’s most recent CA$51.93m liabilities, it seems that the business has not maintained a sufficient level of current assets to meet its obligations, with the current ratio last standing at 0.46x, which is below the prudent industry ratio of 3x.
Does BNE face the risk of succumbing to its debt-load?
With a debt-to-equity ratio of 62.27%, BNE can be considered as an above-average leveraged company. This is not unusual for small-caps as debt tends to be a cheaper and faster source of funding for some businesses. We can check to see whether BNE is able to meet its debt obligations by looking at the net interest coverage ratio. A company generating earnings before interest and tax (EBIT) at least three times its net interest payments is considered financially sound. In BNE’s, case, the ratio of 1.42x suggests that interest is not strongly covered, which means that lenders may refuse to lend the company more money, as it is seen as too risky in terms of default.
Next Steps:
Although BNE’s debt level is towards the higher end of the spectrum, its cash flow coverage seems adequate to meet debt obligations which means its debt is being efficiently utilised. But, its low liquidity raises concerns over whether current asset management practices are properly implemented for the small-cap. This is only a rough assessment of financial health, and I’m sure BNE has company-specific issues impacting its capital structure decisions. I suggest you continue to research Bonterra Energy to get a better picture of the stock by looking at:
Valuation: What is BNE worth today? Is the stock undervalued, even when its growth outlook is factored into its intrinsic value? The intrinsic value infographic in our free research report helps visualize whether BNE is currently mispriced by the market.
Historical Performance: What has BNE’s returns been like over the past? Go into more detail in the past track record analysis and take a look at the free visual representations of our analysis for more clarity.
Other High-Performing Stocks: Are there other stocks that provide better prospects with proven track records? Explore our free list of these great stocks here.
To help readers see pass the short term volatility of the financial market, we aim to bring you a long-term focused research analysis purely driven by fundamental data. Note that our analysis does not factor in the latest price sensitive company announcements.
The author is an independent contributor and at the time of publication had no position in the stocks mentioned.
