
 Yahoo Finance
 Bonds, yields, and why it matters when the yield curve inverts: Yahoo U

On August 14, a closely-watched portion of the yield curve inverted, pummeling the stock market for its worst day of 2019. The yield curve is a powerful predictor of an economic downturn; an inversion has preceded each of the last seven recessions dating back to 1969.
Although the yield curve has a strong track record, it is not a cause of a financial crisis, nor does it share any insight onto the timing and magnitude of a recession. And some say in this case, a recession may never come at all.
To understand the yield curve and why it has become a bellwether of darker economic times, we need to understand the bond market and how treasury yields are calculated.
Bonds: Demand up, yields down?
Bonds are a different asset class than equities (stocks).
The market value of a company’s stock is fairly straightforward; the price goes up and down based on demand.
But search for any government bond (like the 10-year or 30-year Treasury) and you’ll find that the “price” of the bond is quoted as a “yield,” and in percentage form.
This is because, unlike a stock, bonds issue coupon payments at regular intervals (and are therefore considered “fixed income”).
For example, a 10-year U.S. Treasury that has a price of $1000 (also called “par value”) will issue coupon payments until the bond matures (in this case, 10 years). The U.S. government pays out these coupon payments to reward investors willing to bet on its debt.
Those coupon payments therefore determine the payout of holding that bond. So if the coupons total $50 each year, the “yield” on the bond is $50/$1000, which is 5%.
But these bonds are traded in the secondary market, and someone may be willing to buy the bond off of the investor for a higher price. A person who pays $1200 for the bond will still collect $50 each year, meaning that the effective yield on that same bond is now $50/$1200, which is now about 4.2%.
In this case, the demand for the bond has increased the underlying value of the bond, but actually decreased the yield. Conversely, if demand for a bond is weak, the underlying price of the bond will decrease but the effective yield will increase.
So when looking at the quoted yield of a bond in the market, lower yields actually mean higher demand and higher yields actually mean lower demand.
The curve: From one month to 30 years
In the U.S., bonds are available in many durations, as short-term as one month and as long-term as 30 years. Because of the duration element to government bonds, economists tend to look at yields on different Treasuries as a measure of expectations over different time horizons.
Plotting out the secondary market yields on Treasuries gives us the “yield curve,” which in normal times tends to trend upward.
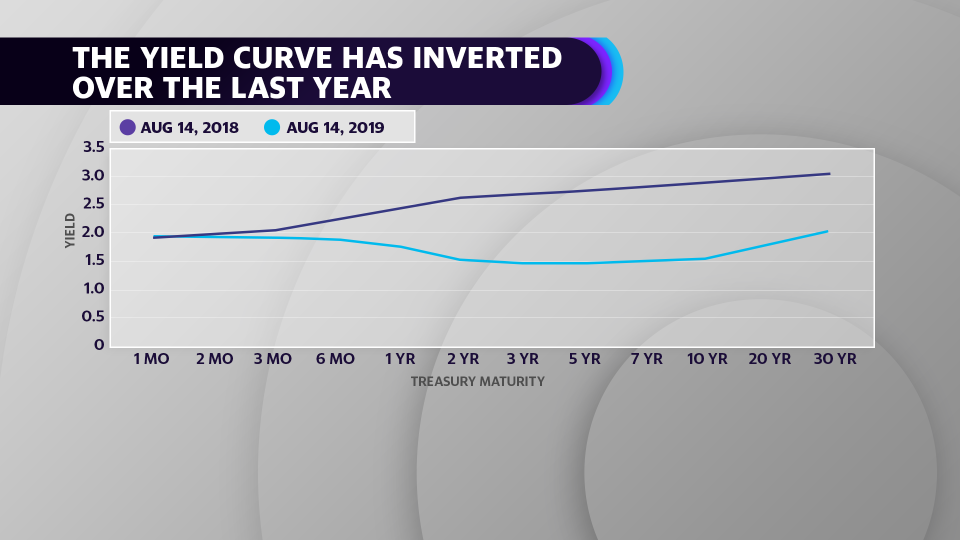
This is because investors generally perceive government debt as a safe haven and relatively risk-free asset, so it offers less return than other riskier asset classes like stocks. And among government debt of different maturities, longer-term bonds tend to have lower demand (and hence higher yields) because investors would prefer to find more lucrative investments than having money trapped for 30-years in a security with relatively small return.
But the curve changes shape when investors start worrying. If prospects for the economy look dark, investors may shift their investments out of riskier asset classes like stocks and reallocate the money toward “safe haven” assets like bonds (or gold).
Since the beginning of 2019, this has been the story for U.S. bonds across the curve. Short-term and long-term bond yields have plummeted amid global inflows into the U.S. fixed income, as concerns of a slowdown in Europe and China push investors to park their money in U.S. government debt.
Inversions and recessions
Demand for longer-term bonds has outsized demand for shorter-term bonds, depressing yields on longer-term bonds at a larger magnitude than yields on shorter-term bonds. Investors most closely watch the 2-year (short-end) and the 10-year (long-end) bond markets because they are the among the more liquid U.S. Treasury markets.
And shortly after 6 a.m. ET on August 14, the 10-year bond yield ticked below the 2-year bond yield by just one basis point. The inversion was brief and the curve ended the day officially un-inverted.
Still, markets sold off as investors piled into safe haven assets, raising concerns of a flight to safety over the possibility of a coming recession.
That’s because the yield curve has called the last seven-for-seven recessions dating back to 1969. The last time the U.S. saw a yield curve inversion was in 2007.
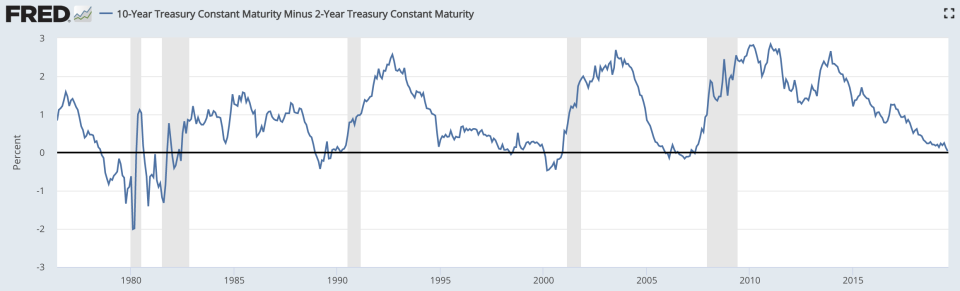
But economists caution that a yield curve inversion is not cause for immediate panic. Bank of America Merrill Lynch pointed out August 13 that it can take between eight to 24 months for a recession to hit after the 2-year and 10-year curve inverts.
And some say that the times are different. Whereas the yield curve measures expectations about the U.S. economy, some market participants have said that the August 14 inversion may be less tied to the U.S. outlook than it is to bleaker economic forecasts in other countries.
Mohamed El-Erian, chief economic advisor at Allianz, told Yahoo Finance August 14 that negative yields on government debt in Europe are pushing investment into the U.S.
“I think the traditional signal is not as valid as the distortions are in driving the yield curve,” El-Erian said.
Aside from timing, an inverting yield curve also does not tell us the strength of the recession, if it does occur. The hope: that if there is a recession, it will not be nearly as powerful as the 2008 financial crisis.
“Most people barely felt that recession, and by the time it hit the headlines in the New York Times, it was over,” Paul Schatz, chief investment officer at Heritage Capital told Yahoo Finance August 16. “That’s the kind of recession I think we see.”
Still, policymakers are on alert as they watch developments unfold. St. Louis Fed President James Bullard told Fox Business on August 15 that a “bearish signal” would only come if the inversion is “sustained over time.”
Brian Cheung is a reporter covering the banking industry and the intersection of finance and policy for Yahoo Finance. You can follow him on Twitter @bcheungz.
YIELD CURVE INVERTS: Recession indicator flashes red for first time
How gas stations and Facebook's Libra pushed the Fed to build a new payments system
Congress may have accidentally freed nearly all banks from the Volcker Rule
Read the latest financial and business news from Yahoo Finance
